


Feedwater pumps are the heart of any steam generation process. As such, they are considered critical assets. Field pump performance testing provides experts with developed head, capacity and efficiency data under normal operating conditions.
Deregulation has given rise to an open market where pump design point and actual operating point may no longer be equivalent and may vary significantly. Such market-driven conditions primarily affect combined-cycle, coal and biomass-fueled generators during Independent System Operator (ISO) dispatch control. Where is the pump operating? Which pump should take overhaul priority? These are certainly valid questions regarding asset availability, reliability and the associated financial consequences of “abnormal operation.”
Where Is the Pump Operating?
In the following example, one boiler feedwater pump (BFP) was selected from a group of eight where proactive field performance testing was accomplished. Performance testing was employed to provide the owner/operator with quantifiable pump condition data to aid in prioritizing unit overhaul schedules. This generation facility is configured with six separate combined-cycle units employing 12 BFPs. The example pump is one of eight axial-split, multistage, ring-section pumps. At the time of field performance testing, gross facility generation was limited by ISO dispatch to 60 percent of full generator/heat recovery steam generator (HRSG) load.
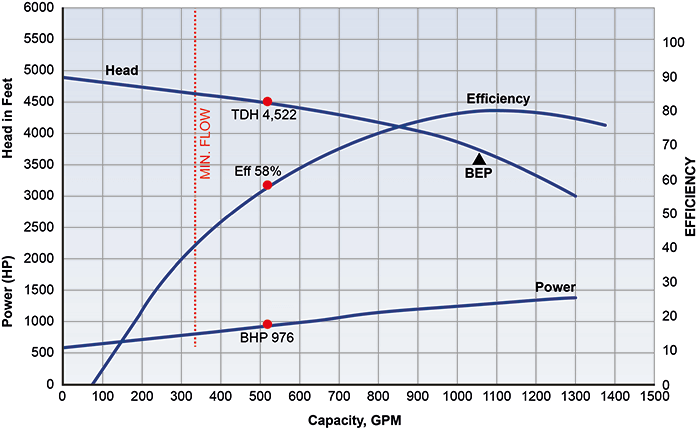 Image 1. Pump actual operating point, flow limited to 49 percent of design point (Images courtesy of Sulzer)
Image 1 shows pump hydraulic performance “as found.” Note how far to the left of best efficiency point (BEP), shown in blue, that test results, shown in red, fall on the original equipment manufacturer (OEM) test curve. Critical pump operation is expected to fall within 70 to 120 percent of BEP. In this case, although test results fall directly on the test curve indicating satisfactory performance, subject pump hydraulic results show operation at 49 percent of BEP. This is a surprisingly common situation.
In addition, in cases where the pump’s net positive suction head required (NPSHr) curve rises with a reduction in capacity, the net positive suction head available (NPSHa) may be insufficient to avoid cavitation. Operation at lower than recommended BEP flows can result in pump inlet flow recirculation leading to increased vibration, wear and reduction in mean time between repair (MTBR).
Which Pump Should Take Overhaul Priority?
Image 2 considers the same group of eight pumps as considered in the first example. By prioritizing time-based overhaul scheduling founded on actual unit performance, the owner/operator can maximize unit reliability and availability.
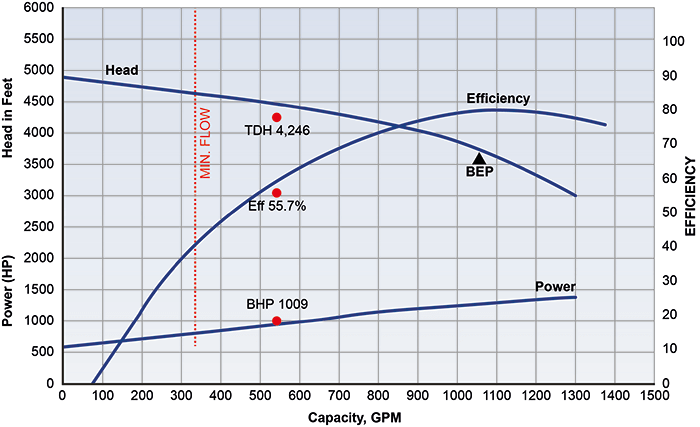 Image 2. BFP C1 hydraulic results indicating increased clearances
 Image 2 shows BFP C1 hydraulic performance results, which are indicative of degraded or less than optimal internal clearances. Results fall below the OEM test curve indicating unsatisfactory performance and that flow capacity is limited to 51 percent of BEP.
Balance line leak-off rate is an excellent and well-documented indicator of internal wear. Image 3 graphically tabulates leak-off rates of the eight subject pumps and, as expected, the largest flow rate recorded was at BFP C1.
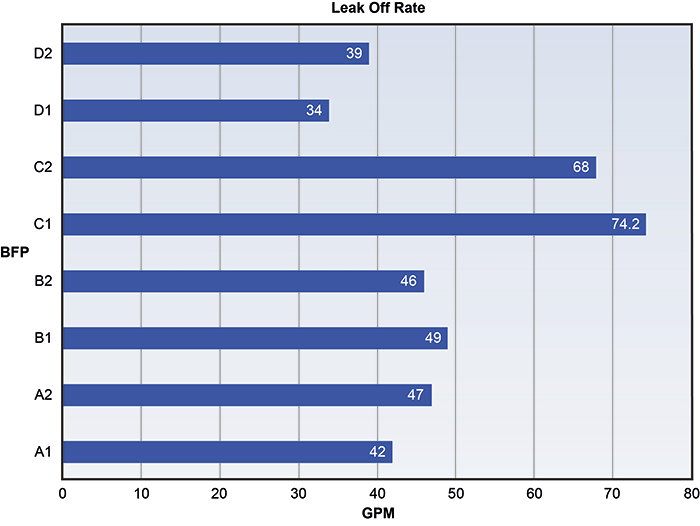 Image 3. Balance line leak-off comparison
 Pump mechanical integrity is also evaluated in addition to hydraulic testing with real-time vibration data being captured and analyzed. BFP C1 vibration response showed clear indication recirculation at the suction side, and BFP C2 exhibited similar response to a lesser degree. Vibration data was consistent with pump hydraulic results and leak-off rates. The facility prioritized overhaul scheduling accordingly.
Field performance testing of critical feedwater pumps provides the owner/operator with quantifiable results and recommendations for their pump(s) in service at plant generation conditions. Proactive periodic testing raises the reliability bar by establishing a benchmark for comparison. Annual or biannual performance testing is recommended.