
My past Pumps & Systems columns (read them here) have dealt with using basic engineering principles to better understand the interaction of pump, process and control elements in fluid piping systems. The articles demonstrate how to hone your troubleshooting skills while improving the operations of piping systems. This month, we will start demonstrating how to use this knowledge to work through problems on real-life systems. I am not calling them case studies because case studies provide a system description, as well as information on the company, the plant facility, the problems encountered and maybe even the people involved. This degree of detail requires multiple levels of permission—even before the lawyers take a look at it. Instead, I will use the line from the movies: "Based on an actual event." In this column, all the names and places have been omitted, but the other pertinent facts are presented. These columns are based on actual system problems I have encountered in my 45-year career in operating, designing, testing and supporting fluid piping systems. Many of the examples come from technical support questions from our software users and feedback from our piping system training classes.
Increasing System Flow Rate
In the late '90s, I was working with an electrical utility in British Columbia that had a program to help its large utility customers reduce their plants' energy consumption. The utility would evaluate a customer's pump systems to see what could be done to reduce energy consumption. I got a call from the consultant performing the analysis on a water makeup system in a nickel mine, where water was pumped from a river to the mill through a 5-mile pipeline. Over the years, the plant's river water requirements increased. The sales engineer for the vertical turbine pump manufacturer was called in each time. The increased system capacity was accomplished by adding stages to the existing vertical turbine pumps, as well as adding new pumps. When I was called, four 10-stage vertical turbine pumps were providing approximately 4,100 gallons per minute (gpm) of river water to the mine with a fifth pump on standby.The Total System
The utility's consultant modeled the river water system using a commercially available piping system simulation program. The river water level was 100 feet above sea level, and the elevation of the mine reservoir liquid level was 435 feet. The supply header was 12-inch steel schedule 40 pipe with a length of 21,000 feet from the river to the mill. The consultant built the system model and asked me if I would look at his results (see Figure 1).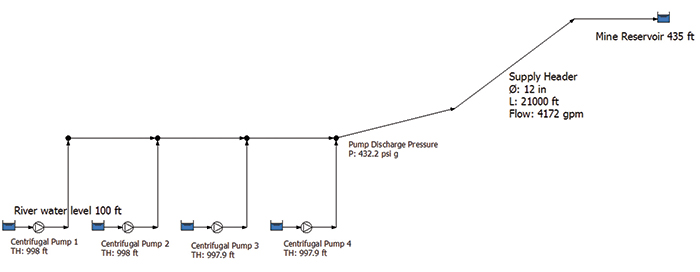 Figure 1. Flow diagram showing the mine water piping system with calculated results (Graphics courtesy of the author)
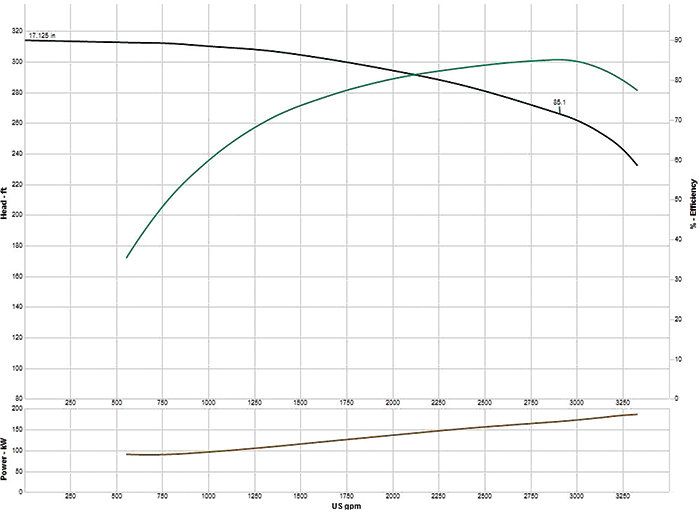 Figure 2. Pump curve for one of four identical 10-stage vertical turbines for the river water system