Editor's Note: This is the fifth in a six-part series on centrifugal pump efficiency. For other articles in this series, click here.
Curve Shape
In Part 2, I showed the effect of specific speed (Ns) on the shape of a pump’s performance curve and its maximum efficiency. A typical performance curve is relatively flat at low values of Ns and becomes steeper as Ns increases. Pump efficiency is lowest at low values of Ns (500 and below) and increases as Ns increases. It reaches its maximum in the mid-to-high 2,000 range and begins to decrease above 3,000. However, the decrease above 3,000 is much smaller than it is below 1,000.
Figure 1 compares the curve shape of four pumps with different specific speeds. It also shows the percent increase in head from best efficiency point (BEP) to shut off. As shown, the slope of the curve increases with Ns. The black curve (Ns = 600) is relatively flat, and this example actually decreases as it approaches shut off.
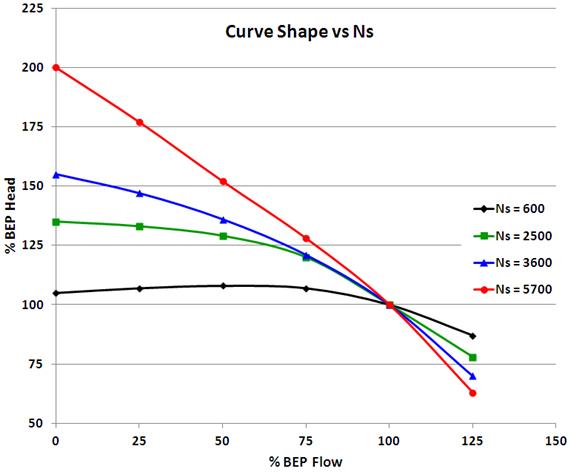 |
| Figure 1. Comparison of four pumps' curve shapes |
The blue curve (Ns = 3,600) also rises continuously but exhibits a 55 percent increase in head. The red curve (Ns = 5,700) is extremely steep, and the head increases by 100 percent from BEP to shut off. Steeper curves usually offer a greater range of control when operated under variable speed control against some fixed elevation or pressure head. These pumps can be problematic when running in parallel or starting against varying system head conditions. The green curve (Ns = 2,500) rises continuously as it approaches shut off, and the head increases by about 35 percent from BEP to shut off.
Flatter curves work fine in across-the-line applications as long as the static or pressure head remains relatively constant. They also work well in closed-loop (and most open-loop) circulation applications when operated under variable speed control.
Although the curves shown are representative of the shape that end users can expect for those values of Ns, they are not cast in stone. For example, pumps with a specific speed range of 900 to 1,200 can be extremely flat, or they could exhibit a 15 to 20 percent rise in head as they approach shut off. The same is true of pumps in the 1,500 to 2,000 range. They can be relatively flat or exhibit a head rise of 20 to 30 percent. The actual conditions will depend upon the individual pump design.
Breadth of Efficiency
For example, a 2 x 2.5 x 8 centrifugal pump with a BEP efficiency of 70 percent at 200 gallons per minute (GPM) drops to 63 percent at flows below 190 GPM or over 210 GPM. Since pumps seldom operate at BEP, a wide range of high efficiency can allow for design errors and potential changes in the system.All pumps reach their peak efficiency at BEP, but the range of peak efficiency can vary significantly from model to model. Some pumps—especially lower flow models—exhibit a narrow BEP range, and once flow is out of that range, efficiency drops quickly.
Figure 2 shows the variable speed curves for a pump with a specific speed of 1,654. It exhibits a rise in head toward shut off of about 30 percent and a wide range of high efficiency.
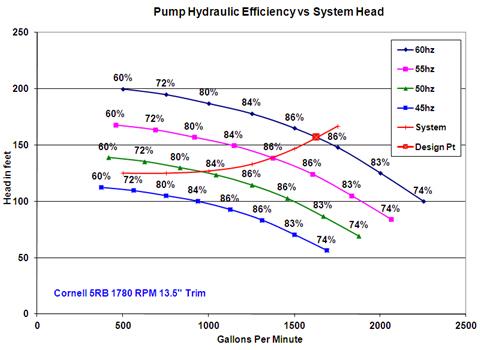 |
| Figure 2. Variable speed curves for a pump with a specific speed of 1,654 |
When running across the line (60 hertz curve), this pump will maintain its BEP efficiency of 86 percent from 1,500 to 1,750 GPM. The head change across this range is about 17 feet and allows for incorrect duty point head calculations, as well as aging of the system. It still performs at 85 percent from 1,375 to 1,875 GPM and will maintain 84 percent from 1,250 to 1,900 GPM.
If this pump were operating in a variable speed application, against the system curve shown in red, its control range would be about 12 hertz (49 to 60 hertz), and it would maintain 86 percent efficiency from 1,375 to 1,625 GPM. Efficiency would still be at 85 percent down to 1,250 GPM and would remain at a robust 84 percent down to 1,050 GPM. This high efficiency across the range of flow enhances the power reduction due to a change in speed.
Next month, I will end this series by looking at some examples of when pump efficiency is important and when it is not so important.