It is common for process plants to contain many centrifugal pumps. In continuous processes, the conventional method for continuously controlling a pump is to throttle a control valve. The purpose is to defend the controlled variable against disturbances by adjusting the manipulated variable. In pump systems, the manipulated variable is usually the flow of liquid. When designing a pump system, process engineers typically calculate the static and dynamic pressure drop of the pipework, fittings, in-line equipment and in-line instrumentation at a fixed design flow rate. They then add the control valve’s pressure loss, which often is derived from experience. This is traditionally a fixed value of between 0.2 and 0.5 bar. Another way is to allocate a certain percentage, for example, 25 to 50 percent of the dynamic pressure loss of the system-head curve’s to the control valve’s pressure drop.1
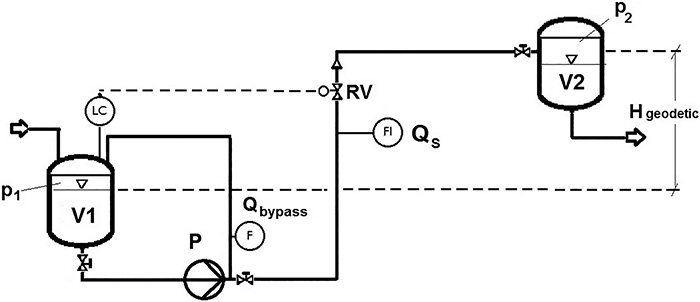 Figure 1. Schematic of a simple pump system (Pump P) with Control Valve RV, adjusted by a level controller in Vessel V1. Design flow rate is Q. (Graphics courtesy of Pumpenfachingenieur GmbH)
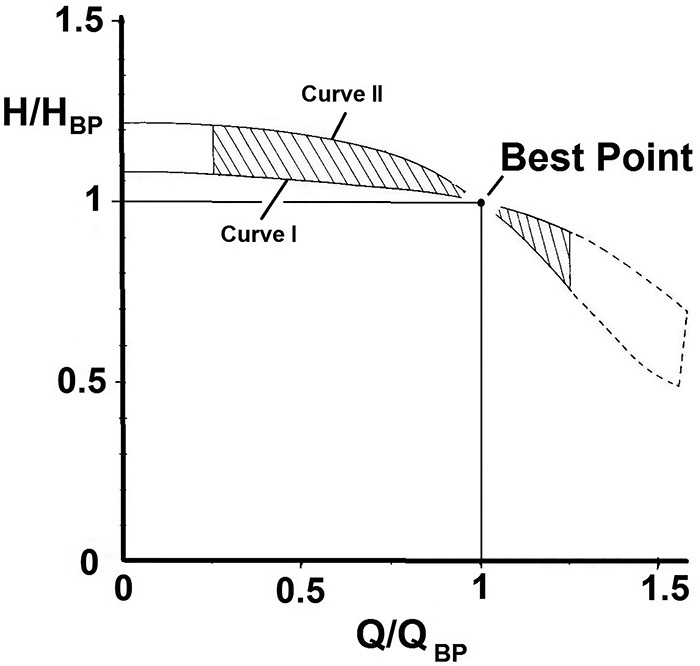 Figure 2. Field of radial centrifugal pumps’ dimensionless characteristics limited by Curves I and II.
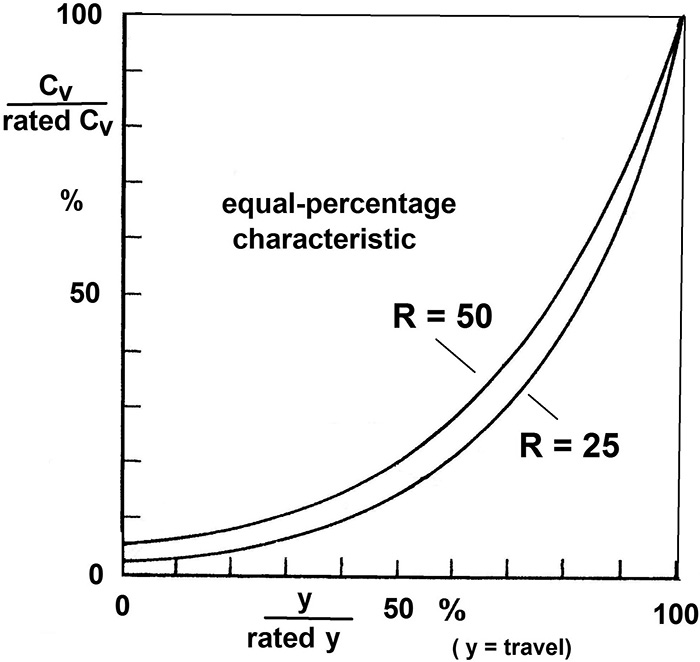 Figure 3. Characteristics of equal-percentage control valves of different rangeability R.


Influence of the System’s Parameter
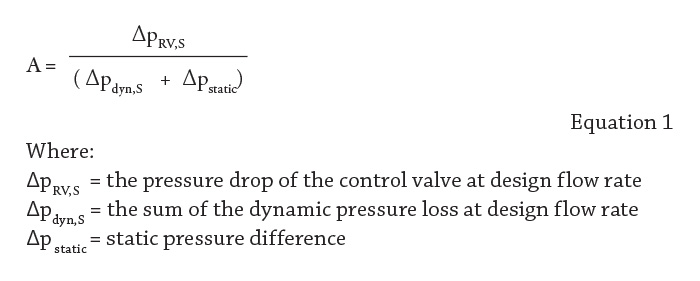
A calculation of the system in Figure 1 was performed with some simplifications (for example, a negligible pressure drop on the suction side and also from the pressure side of the pump to the fork-off point of the bypass). The calculation assumed a fixed bypass flow of 10 percent of flow at BEP, and the pressure drop of the control valve at design was fixed to a travel of 70 percent. The control valve featured an ideal equal-percentage characteristic and a rangeability of 25 and 50, respectively. Calculation results are shown in Figure 4 and are based on pump characteristic Curve I. The relative maximum flow rate is plotted versus A, the relative pressure drop of the control valve at design. Parameter B constitutes the system’s relative dynamic pressure loss. The same calculation was performed based on the pump’s characteristic, as demonstrated by Curve II (see Figure 5).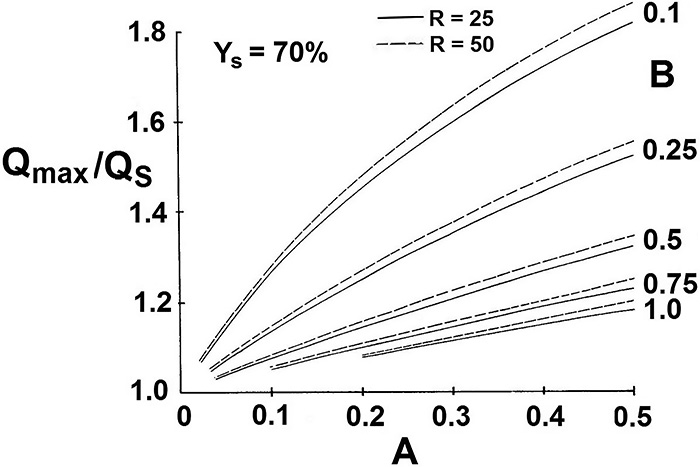 Figure 4. Maximum flow dependent on relative pressure loss of control valve, variable A, based on Curve I of Figure 2. Parameter B represents the relative dynamic pressure loss of system.
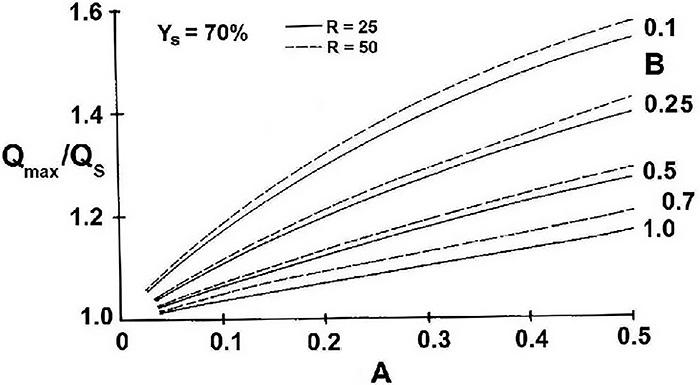 Figure 5. Maximum flow dependent on relative pressure loss of control valve, variable A, based on Curve II of Figure 2. Parameter B represents the relative dynamic pressure loss of system.
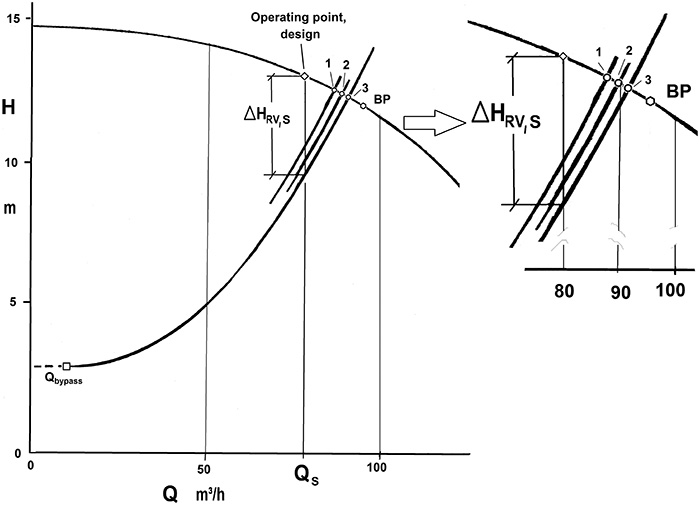 Figure 6. Example of the influence of a control valve’s rangeability on maximum flow rate.
- Point 1 (base case): R = 25; Qmax/QS ≈ 109 percent with linear characteristic of control valve
- Point 2: R = 25; Qmax/QS ≈ 113 percent for equal-percentage characteristic
- Point 3: R = 150; Qmax/QS ≈ 114 percent for equal-percentage characteristic—a straight pipe replacing the control valve resulting in Qmax/QS ≈ 115 percent
Conclusion
Qualitatively, the steeper a pump’s characteristic falls, the smaller the maximum flow rate, and the higher the relative dynamic pressure loss of the system, the smaller the maximum flow rate. The parameter “design flow rate” and “design pressure loss and travel” of the control valve establish the reference values. As a result, increasing a specified design flow rate by 10 percent, for example, without also increasing the pressure the pump delivers does not mean that the system will necessarily achieve this flow rate. References- Yu, F.C., “Easy way to estimate realistic control valve pressure drops,” pp. 45-48, Hydrocarbon Processing, August 2000
- Unnikrishnan, G., “Visualize pump and control valve interaction easily,” pp. 51-56, Hydrocarbon Processing, August 2007
- Jerdal, W.A. et al., “Dimensionless Characteristics of Pumps With Specific Speeds nq = 20…80,” pp. 546- 550, Transaction ASME, Vol. 124, June 2002
- Green, D.W., Perry R.H., “Perry’s Chemical Engineers’ Handbook,” 8th ed., Section 8, p. 8-83

