
In my experience, few plant personnel are concerned with how a pump is running until after it breaks down. When the whole plant unexpectedly shuts down, then the pump gets attention. By simply monitoring pump pressures, however, users can avoid this problem. The equipment will usually tell you there is an issue long before the failure. You just need to know how to watch and listen for the signals. To quote a good friend and fellow pump expert, Larry Bachus, "Would you want to drive a car that didn't have a dashboard?" The Occupational Safety and Health Administration (OSHA) reports that most workforce accidents occur when a plant is in an emergency (unscheduled) situation. If you want to increase reliability and reduce the high costs and safety risks associated with emergency shutdowns, adding gauges and managing the data are simple and inexpensive first steps.
Gauges
Gauges will measure pump performance and display the differential pressure across the pump. That information, in conjunction with knowledge of the pump and system curves, will provide plenty of details about the health of the pump and system. The differential pressure is key to knowing where the pump is on its operating curve. Converting the differential pressure to head will show a location on the curve. Convert pressure to head by multiplying the differential pressure by 2.31 and dividing that product by the specific gravity. Another related issue that I witness often is originally installed gauges that are missing, broken, ignored, not calibrated or compensated, and/or not logged. The gauge by itself cannot save you from pump failure and consequential plant shutdown. A trained person must read the gauge regularly and record the data. Some systems with pressure transducers do this automatically. At that point, however, the data alone is still not useful information. The recording operator must be trained to know the process dynamics and be able to determine if the reading is in or out of specification.Pump Curves
The pump will operate at the point on its curve where it is intersected by the system curve. Note that this is usually a changing dynamic, not a fixed point. As the pump curve changes with impeller size, speed and wear (clearances open up), the system curve changes with wear, process control changes, corrosion and/or marine growth buildup. Figure 1 shows that pump curves change with size, speed and wear (curves A and B). The system curve(s) (curves X and Y) also changes with wear, corrosion, buildup (such as fouling or marine growth) and the position of system management components. Where the pump operates over time is not a constant or fixed point. Where the pump operates on its curve affects the health of the pump.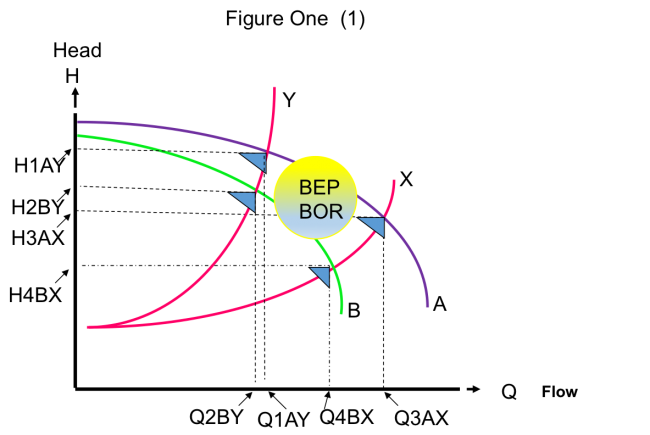 Figure 1. This chart shows how pump and system curves can change due to various factors. (Courtesy of the author)
A pump experiences the least amount of deleterious issues when operating at or near its design point. This region is commonly known as the best operating region (BOR) or best efficiency point (BEP). When operating away from its BEP, the pump is subjected to increasingly high radial forces (deflection), cavitation (erosion and vibration), recirculation (cavitation and inefficiency), thermal issues and vibration. Running outside of the correct range typically results in premature mechanical seal and bearing failures.
By measuring the differential pressure generated across the pump (the difference between the suction pressure and the discharge pressure), you can easily determine with a high degree of accuracy where the pump is operating on its curve and if that point is in the acceptable range. If the pump is not operating in an acceptable range, make adjustments so that it is operating in the "sweet spot." For example, the system may require a change in pump speed, impeller diameter or clearance, or the system curve may be revised by changing a control valve position or cleaning a filter/strainer or heat exchanger. As the pump system ages and wears, the curves will reflect the change. If collecting data for specified metrics, you will be able to make pump and system changes in a timely manner.
The following 10 tips provide guidance for using gauges to achieve better pump life management.
1. Gauges have been around the industrial world for a long time (the Bourdon-tube gauge was patented in 1849), and they are simple and relatively inexpensive. In addition to gauges, end users can adopt more current technology by substituting pressure transducers (digital gauges). Transducers can report data to other and, frequently more convenient, locations.
2. I recommend using two gauges on the pump, one on the suction and one on the discharge. As a "Plan B," use one differential pressure gauge. This is better than no gauges at all.
3. Suction pressure commonly falls below atmospheric pressure in operation, even on flooded suctions, so it is advisable to use a compound pressure gauge or absolute pressure gauge on the suction side.
4. I recommend using absolute pressure gauges to avoid error in calculating the differential pressure. You will also better understand where the pressure actually is. If during operations, the suction pressure is changing from above and below atmospheric under different conditions, there are fewer issues.
5. Many companies specify that gauge "taps" (penetrations drilled and tapped) be put on the pump flanges. It may be easier and less expensive to have them on the adjacent piping. Threaded taps on flanges become a site for cracks, corrosion and erosion of the pump casing. A section of pipe is much less expensive than a pump casing.
6. Should you place gauges on the adjacent piping, be aware that differences in elevations will need to be compensated to a common datum point, usually the pump (or impeller) centerline. Also note the size of the pipe and the flow rate and then understand that gauges (transducers) measure pressure, not velocity.
7. In most centrifugal pumps, up to 25 percent of the total head generated occurs in the throat area of the volute (casing) (near the discharge flange) and the velocity-to-pressure (head) conversion will still be taking place for several pipe diameters downstream of the flange. A pressure gauge placed four to six pipe diameters downstream of the discharge flange will yield a more accurate head reading. Note that the gauge should be placed before the isolation and check valve to be accurate.
8. Many facilities do not use gauges because of issues with vibrations and pressure pulsations or because of safety issues with the fluid. I recommend the use of snubbers, loops, capillary tubes and isolation valves to mitigate the problem. Consult with the gauge and transducer manufacturers for more details. If using gauge isolation valves, use two valves to ensure that "lockout/tagout" restrictions will be in compliance.
9. Some plants do not incorporate gauges for a variety of reasons. For those facilities, I recommend at least an isolated/capped or plugged penetration where a gauge, transducer or digital gauge can be installed.
10. Select the gauge (transducer) to be in the correct pressure range for the application. Gauges are most accurate in the middle one-third of their total range. Do not forget temperature ratings and compensation in that selection process.
Figure 1. This chart shows how pump and system curves can change due to various factors. (Courtesy of the author)
A pump experiences the least amount of deleterious issues when operating at or near its design point. This region is commonly known as the best operating region (BOR) or best efficiency point (BEP). When operating away from its BEP, the pump is subjected to increasingly high radial forces (deflection), cavitation (erosion and vibration), recirculation (cavitation and inefficiency), thermal issues and vibration. Running outside of the correct range typically results in premature mechanical seal and bearing failures.
By measuring the differential pressure generated across the pump (the difference between the suction pressure and the discharge pressure), you can easily determine with a high degree of accuracy where the pump is operating on its curve and if that point is in the acceptable range. If the pump is not operating in an acceptable range, make adjustments so that it is operating in the "sweet spot." For example, the system may require a change in pump speed, impeller diameter or clearance, or the system curve may be revised by changing a control valve position or cleaning a filter/strainer or heat exchanger. As the pump system ages and wears, the curves will reflect the change. If collecting data for specified metrics, you will be able to make pump and system changes in a timely manner.
The following 10 tips provide guidance for using gauges to achieve better pump life management.
1. Gauges have been around the industrial world for a long time (the Bourdon-tube gauge was patented in 1849), and they are simple and relatively inexpensive. In addition to gauges, end users can adopt more current technology by substituting pressure transducers (digital gauges). Transducers can report data to other and, frequently more convenient, locations.
2. I recommend using two gauges on the pump, one on the suction and one on the discharge. As a "Plan B," use one differential pressure gauge. This is better than no gauges at all.
3. Suction pressure commonly falls below atmospheric pressure in operation, even on flooded suctions, so it is advisable to use a compound pressure gauge or absolute pressure gauge on the suction side.
4. I recommend using absolute pressure gauges to avoid error in calculating the differential pressure. You will also better understand where the pressure actually is. If during operations, the suction pressure is changing from above and below atmospheric under different conditions, there are fewer issues.
5. Many companies specify that gauge "taps" (penetrations drilled and tapped) be put on the pump flanges. It may be easier and less expensive to have them on the adjacent piping. Threaded taps on flanges become a site for cracks, corrosion and erosion of the pump casing. A section of pipe is much less expensive than a pump casing.
6. Should you place gauges on the adjacent piping, be aware that differences in elevations will need to be compensated to a common datum point, usually the pump (or impeller) centerline. Also note the size of the pipe and the flow rate and then understand that gauges (transducers) measure pressure, not velocity.
7. In most centrifugal pumps, up to 25 percent of the total head generated occurs in the throat area of the volute (casing) (near the discharge flange) and the velocity-to-pressure (head) conversion will still be taking place for several pipe diameters downstream of the flange. A pressure gauge placed four to six pipe diameters downstream of the discharge flange will yield a more accurate head reading. Note that the gauge should be placed before the isolation and check valve to be accurate.
8. Many facilities do not use gauges because of issues with vibrations and pressure pulsations or because of safety issues with the fluid. I recommend the use of snubbers, loops, capillary tubes and isolation valves to mitigate the problem. Consult with the gauge and transducer manufacturers for more details. If using gauge isolation valves, use two valves to ensure that "lockout/tagout" restrictions will be in compliance.
9. Some plants do not incorporate gauges for a variety of reasons. For those facilities, I recommend at least an isolated/capped or plugged penetration where a gauge, transducer or digital gauge can be installed.
10. Select the gauge (transducer) to be in the correct pressure range for the application. Gauges are most accurate in the middle one-third of their total range. Do not forget temperature ratings and compensation in that selection process.