
Pumping Prescriptions
06/08/2016
Editor's note: Reg Christmas of Kemira Chemicals Inc. contributed to this column. This column discusses the results of an eight-year reliability study conducted at a chemical plant. The plant uses six horizontal split-case cooling water pumps to provide cooling water to the production facility. These six pumps operate in banks of two units, taking suction from three cooling towers and feeding cooling water to three plant processes:
- Crystallizer condenser (Cooling Tower A feeding Pumps A and B)
- Process 3040 (Tower B feeding Pumps C and D)
- Process 5060 (Tower C feeding Pumps E and F)
.jpg) Figure 1. Working copy of a pump performance curve (Graphics courtesy of the authors)
Figure 1. Working copy of a pump performance curve (Graphics courtesy of the authors)Evaluating Performance
As shown in Figure 1, the best efficiency point (BEP) is at 4,800 gallons per minute (gpm) for the 11.4-inch impeller. The actual flow varies from approximately 1,500 to 6,500 gpm, depending on the process demand. As the study showed, Pumps A and B operated, on average, at a higher flow than Pumps C through F. The main indicator of reliability degradation, which typically indicates a need for repair or overhaul, is a significantly increased level of vibrations. To assess this parameter, the overall level of vibrations was measured at four locations: inboard and outboard bearing housings of the pumps and motors as well as at horizontal, vertical and axial directions at each position, equaling a total of 12 data points per monthly test. The highest value of the 12 is plotted on the charts shown in Figure 3 (page 16).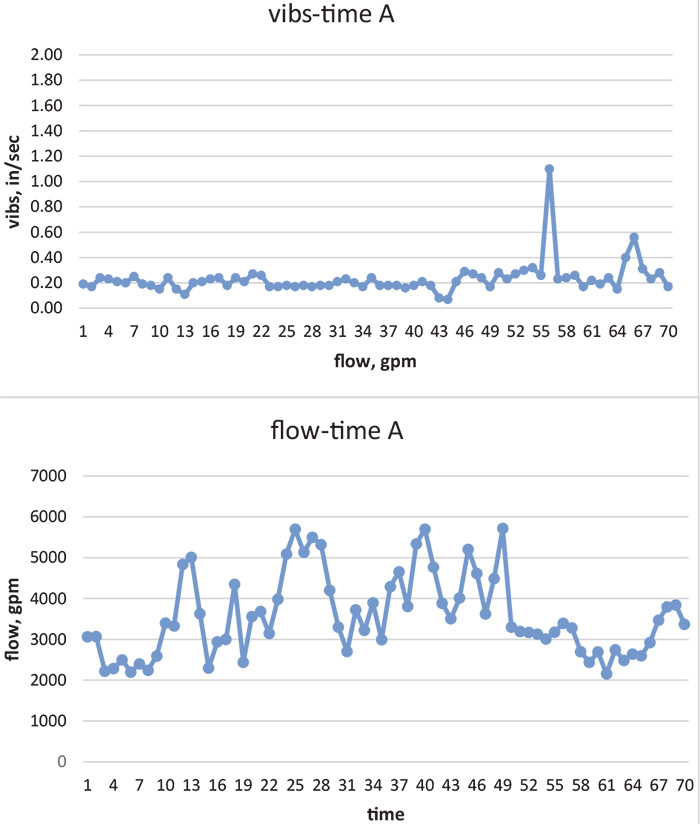 Figure 2. Vibrations and flow with time for Pump A
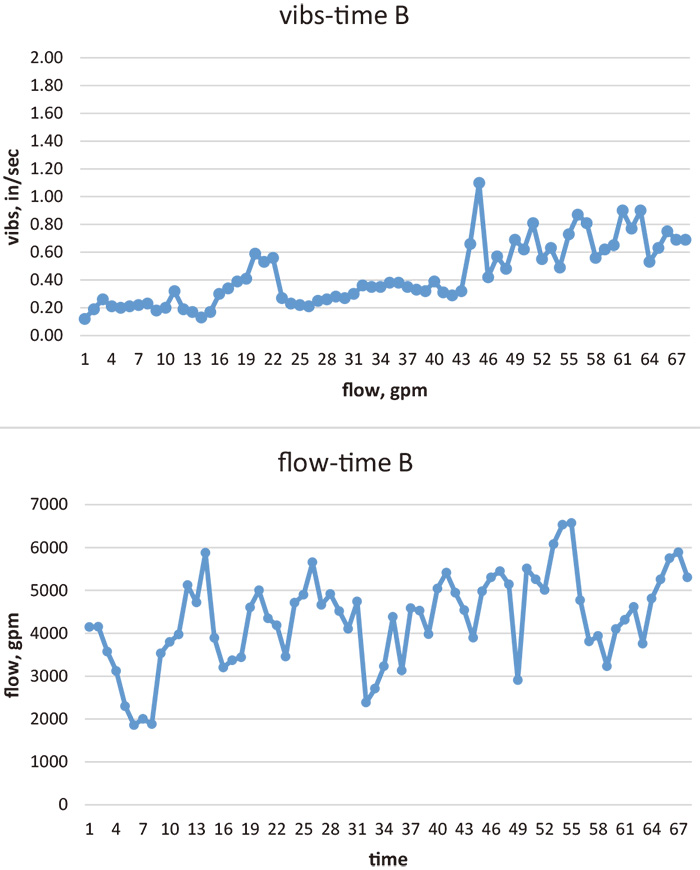 Figure 3. Vibrations and flow with time for Pump B
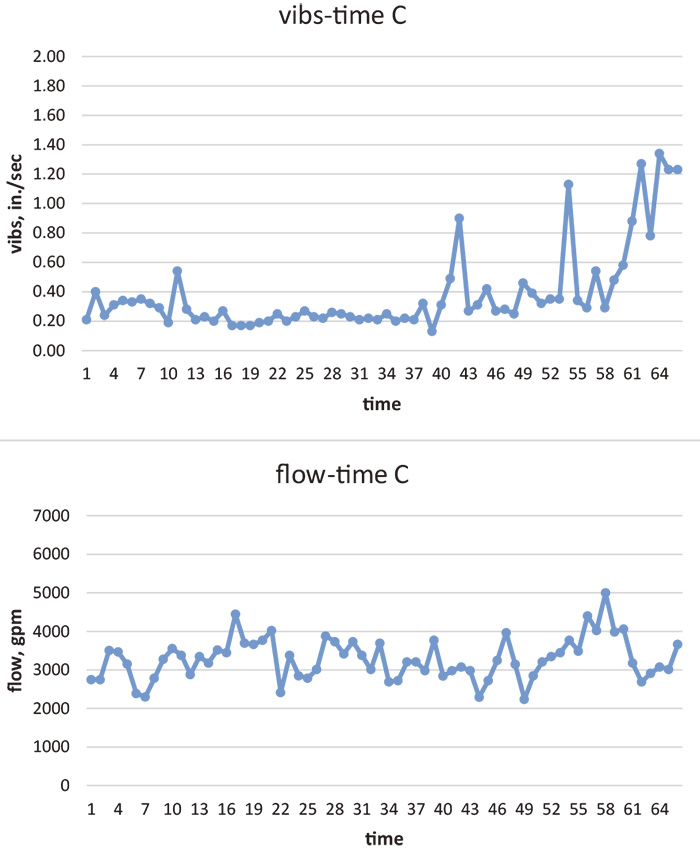 Figure 4. Vibrations and flow with time for Pump C
- Pumps A and B operate, on average, (disregarding occasional abnormalities) toward higher flow as compared with Pumps C through F. Pumps A and B operate between 2,000 and 6,000 gpm. Pumps C through F operate between 2,000 and 4,000 gpm. While far from perfect, this data implies that Pumps A and B operate, on the average, closer to the BEP, so they are expected to have better reliability.
- There seems to be no clear correlation between vibration and flow, meaning there is no correlation between failure rates and flow.
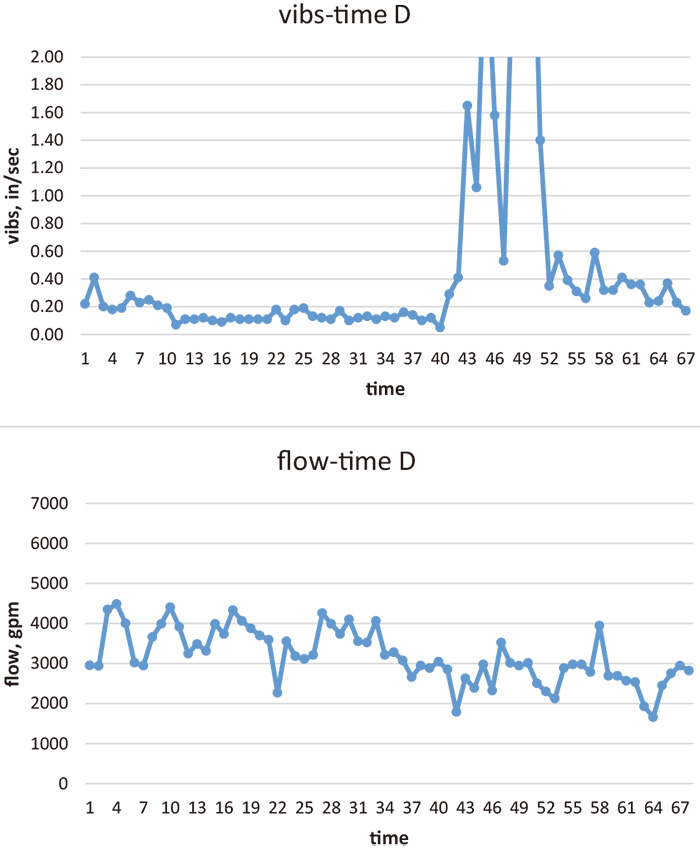 Figure 5. Vibrations and flow with time for Pump D
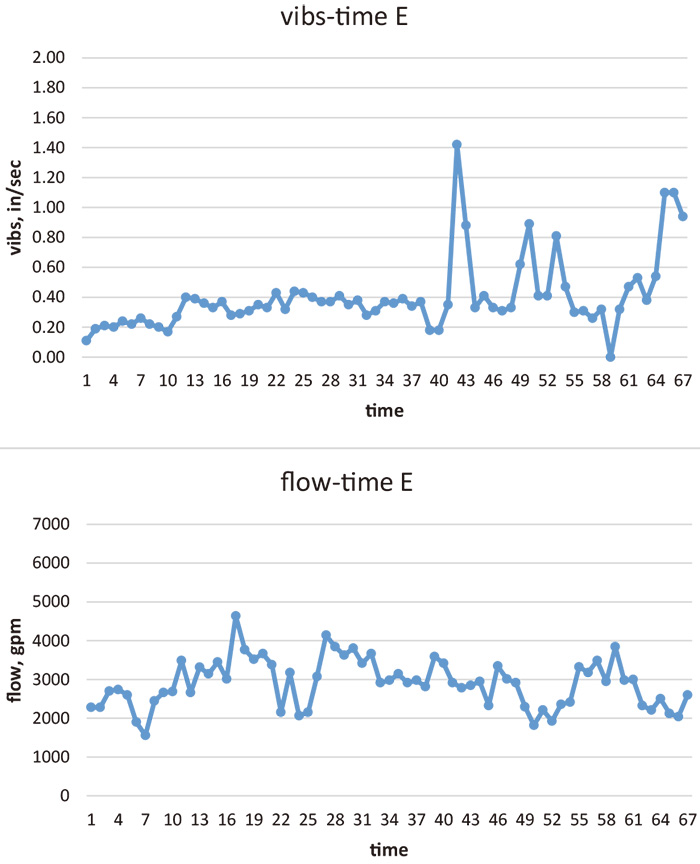 Figure 6. Vibrations and flow with time for Pump E
- Pump A shows two substantial spikes in vibrations (near time 55 and time 67) where the rotors were replaced, resulting in a significant decrease in vibrations until the next large spike, resulting in another rotor replacement.
- Pump B shows spikes at times near 22 and 46.
- Pump C shows spikes at times near 13, 43, 55 and 64.
- Pump D shows spikes at times 43, 46 and 52.
- Pump E shows spikes at times 43, 52 and 67.
- Pump F shows spikes at times 27, 33 and 43.
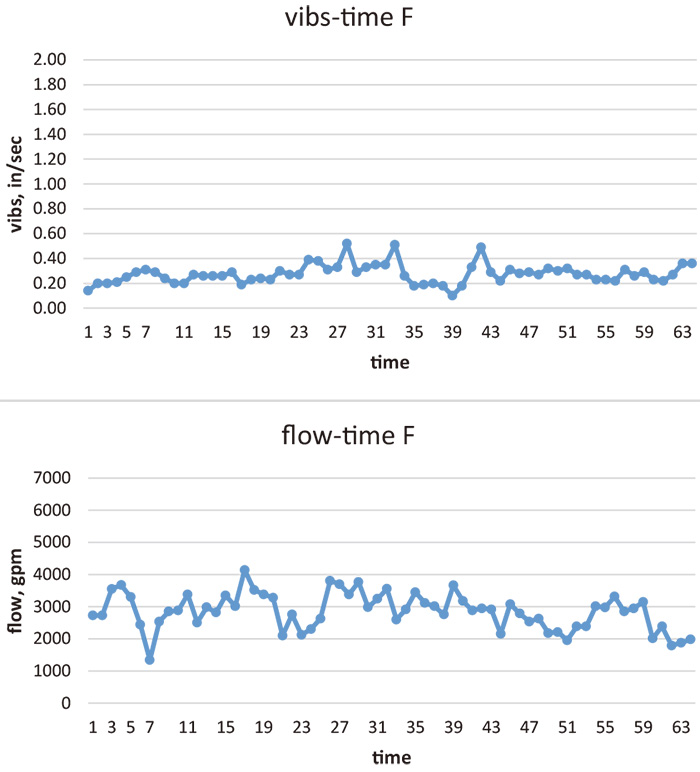 Figure 7. Vibrations and flow with time for Pump F
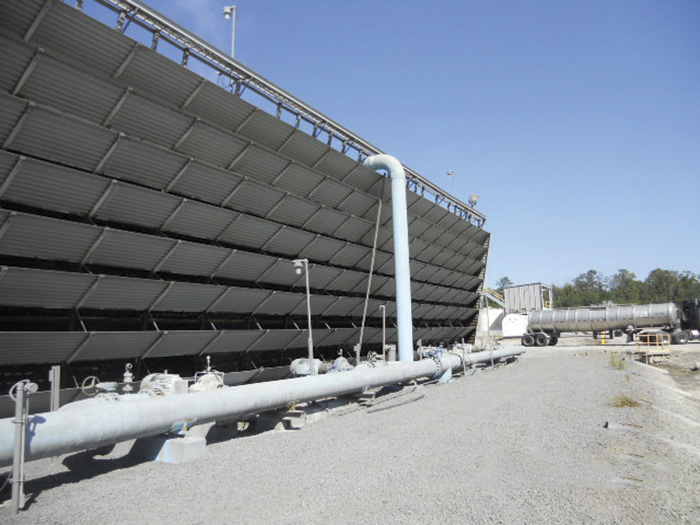
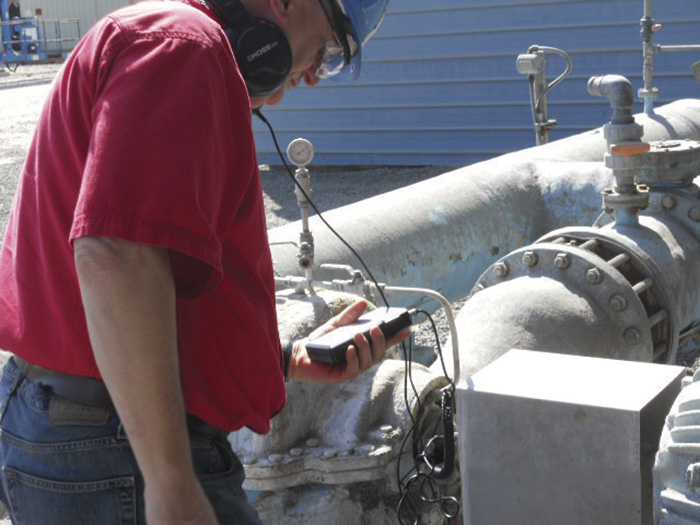
.jpg) Images 1, 2 & 3. Overall view of the system, showing the six pumps in the study
Images 1, 2 & 3. Overall view of the system, showing the six pumps in the study- Nelik, L., "Energy/Efficiency Studies by On-Line Efficiency Monitoring System (PREMS-2A), doctorpump.com
- Nelik, L. and Moskovich, D., "Efficiency Evaluation for the Vertical Turbine Pump, Clean Water Well", Weizmann Institute reports
- Pumping Machinery Technology Program, PREMS-2A (Pumps Reliability and Energy Monitoring System): pumpingmachinery.com/pump_school/PVA/pva.htm (module #11 and #10)
See other Pumping Prescriptions articles here.
