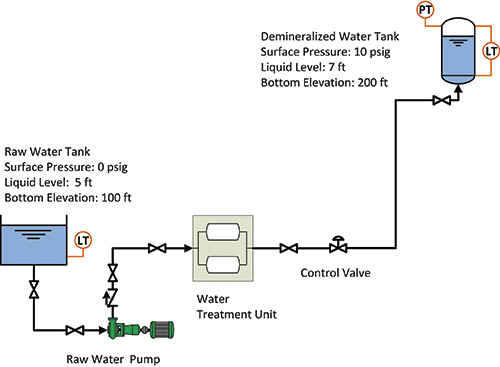
My last column (Pumps & Systems, April 2014) explained why resistance in implementing pump system improvement programs often occurs. Because pump systems touch many disciplines and departments within an operating plant, it is difficult for everyone involved to clearly understand how a piping system operates. In this month’s column, a piping system will be discussed, including the individual items and how they work together as a total system. It will explain the system’s operation so that everyone in the plant can visualize its function. Figure 1 shows a demineralized water supply system consisting of a pump, two tanks, a water treatment unit, pipelines and a control valve. The elements can be grouped into three general categories based on how the energy is used in the piping system. The pump element is the only component that adds hydraulic energy to the fluid in the system. The process elements consist of the equipment required to create the product or provide the service. Hydraulic energy is consumed when the fluid passes through the process element to make demineralized water. The control valve regulates the flow rate through the system to improve the product quality and system efficiency.
 Figure 1. Demineralized water system
Pump Element
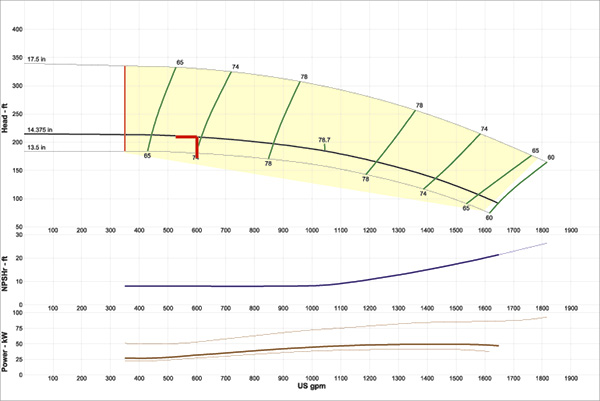
The pump adds hydraulic energy to the piping system. The pump curve for the raw water pump (see Figure 2) shows the pump head, efficiency and power consumption for its range of operation. A pump must always operate on its curve. Looking at the pump curve at a flow rate of 600 gpm, the pump produces 209 feet of head. For this pump to achieve the flow rate of 600 gpm, the 209 feet of head produced by the raw water pump must be accounted for in the process and control elements in the system. Figure 2. Pump performance curve for the raw water pump
Process Elements
The tanks provide a recognized system boundary and an easily determined value for the hydraulic energy that remains fairly constant during operation. The locations, elevations and pressure of the tanks are determined by the needs of the process along with the space constraints of the plant. In Figure 1, a 102-foot elevation difference between the liquid level in the raw water and demineralized water tanks exists. This difference in elevation must be overcome by the pump and is referred to as the elevation head. In addition, a 10 psi difference in pressure between the raw water and demineralized water tanks must be overcome. Converting the pressure value for feet of fluid results in an additional 23 feet required by the pump. This pressure difference between the tanks is referred to as pressure head. The difference in elevation and pressure must be overcome regardless of the flow rate through the system. As a result, the elevation head and pressure head values are combined and referenced as static head. The resulting static head for this system is 102 feet + 23 feet or 125 feet of fluid. The losses in the pipelines are caused by the friction between the moving fluid and the stationary pipelines. The pipeline head loss can be calculated using the Darcy equation, with examples found in any fluid textbook. In this system, the head loss because of pipe friction is 2.6 feet of fluid when 600 gpm of water flows through the system. The final process element in this example is the water treatment unit. According to the manufacturer, a pressure drop of 5.6 psi, or a head loss of 12.9 feet, occurs with a flow rate of 600 gpm. Adding the static head, the dynamic losses of the pipeline with a 600 gpm flow rate and water treatment unit, the energy consumed by the system is: h = 125 ft + 2.6 ft + 12.9 ft = 140.5 ftControl Element
The control element regulates the flow into the demineralized water tank to maintain a constant tank level. Because 600 gpm is the plant’s demineralized water demand, it is also the average flow rate through the control. A flow rate of less than 600 gpm causes the tank level to decrease, resulting in insufficient flow to the other plant loads. A flow rate greater than 600 gpm causes the tank to overflow, resulting in a waste of demineralized water.Energy Balance
As previously mentioned, the pumps provide all the fluid energy to the system. The process elements consume energy as fluid passes through the system to make the product or provide the service. The control elements consume energy to regulate the flow of fluid through the system required to optimize the process. Based on the energy usage, the following expression can be assumed: hpump = hProcessElements + hControlElements Rearranging the formula above, the head loss associated with the control element required to limit the flow rate through the system to 600 gpm is: hControlElements = hpump – hProcessElements = 209 ft – 140.5 ft = 68.5 ft Converting the head loss to differential pressure, a 29.7-psi pressure drop across the control valve is required to regulate the system flow at 600 gpm.Gaining a Clear Picture
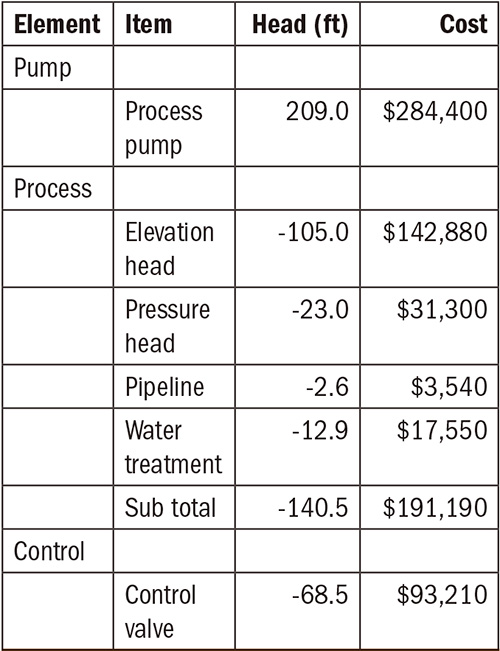
As mentioned in last month’s column, pushback while implementing system improvements happens because of a lack of understanding about how the system operates by those involved in the process. The results determined that many detailed calculations were needed to understand this relatively simple process. An electric motor is driving the pump, and the plant electrical engineer is familiar with the volts, amps, power factor and motor efficiency needed to determine the motor power required to drive the pump. The plant mechanical engineer is familiar with the pressure, head, flow and pump efficiency required to calculate the power required by the pump. The process engineer understands the water purification process along with the necessary pressure and flows required to make a quality product. The plant engineer knows how much pressure and flow rate is needed by each load to meet the plant’s pure water needs. However, a clear understanding of how the total system operates, how much this system costs to operate and how efficiently it is operating is missing. Using the system information calculations, Table 1 shows the hydraulic energy usage and associated costs. Note the energy supplied by the pump is consumed by the process and control elements. Table 1. The energy balance for the system—hydrauilc energy usage in the demineralized water system including all associated costs
