Parallel operation is a setup in which two or more pumps take suction from the same suction header and deliver liquids into the same discharge header. In theory, if the two pumps and piping are identical in design, they should pump at approximately the same flow rate. However, differences in piping, pump performance and internal wear often lead to flow discrepancies in pumps operating in parallel. Indiscriminate parallel operation of centrifugal pumps may lead to significant flow imbalances that can result in pump vibration, pulsations, overheating and failure. Pump users should always confirm that pumps are similar in performance capabilities before operating them in parallel. Individual flow meters can help ensure that pumps are operating at a safe flow when in a parallel arrangement. A total flow meter for a group of pumps is more common. In one scenario, two centrifugal pumps—nine-stage, 125-horsepower (hp) vertical turbine pumps—are installed side by side. They transfer pipeline liquids collected upstream of a compressor station into another pipeline. These pumps were never intended to operate in parallel. Normally, one of the pumps can handle all liquids reaching the station.
One application used a pump flow algorithm in place of a conventional flow meter to protect pumps in parallel operation.
Enterprise Products
01/27/2017
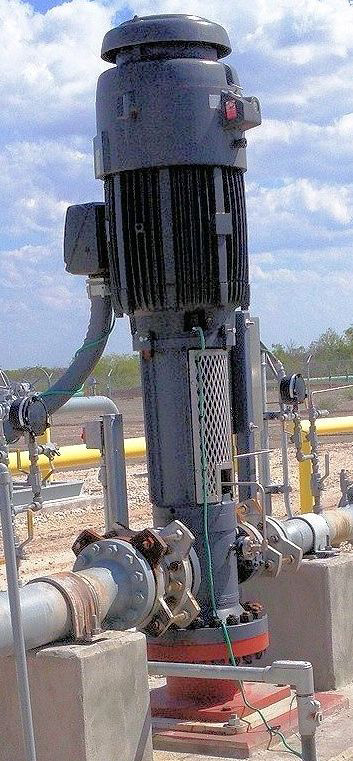
Image 1. One of two nine-stage, 125-hp vertical turbine pumps that are rated for 350 gallons per minute (gpm) and 3,550 revolutions per minute (rpm) (Images and graphics courtesy of Enterprise Products)
After the pumps had been operating for some time, personnel discovered that one pump was not sufficient to handle all the liquids. Operators sometimes had to shut down the compressors downstream of these pumps because of the high risk of damage resulting from liquid carryover. For this reason, facility personnel decided to operate both pumps simultaneously in order to handle upset conditions.
On paper, these pumps appeared to be identical, so personnel believed that parallel operation would result in a balanced flow condition. However, the team knew that one or both could operate at unsafe conditions because of internal wear, slight differences in pump construction, changing process conditions and other factors. So personnel allowed parallel operation only when flow measurements were available for each pump.
To properly protect the pumps, the team needed to install individual flow meters. Personnel considered different pump flow measurement options including an orifice flow meter, a compact flow meter such as an Annubar flow meter, and calculated flow using motor power and pump differential pressure.
Because of the lower cost and minimal impact on the site, the team elected the option of calculated flow using motor power and pump differential pressure. Because digital pressure transmitters were already installed and a local programmable logic controller (PLC) was available, all the team needed was local power meters to estimate pump flow.
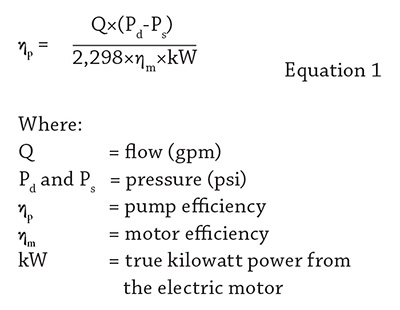
The team began their analysis using Equation 1, which was developed to approximate the efficiency of a centrifugal pump in the field. This equation can determine a motor-driven centrifugal pump’s efficiency under process conditions. This equation does not require the fluid’s specific gravity, which is useful when the specific gravity of the pumped liquid is not known.
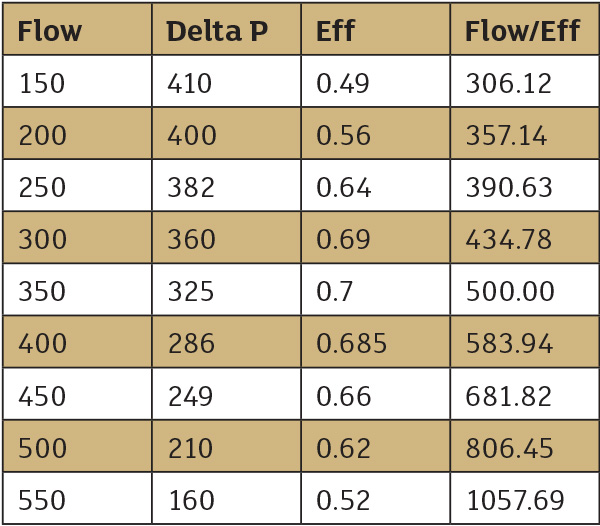
Table 1. Pump performance data
Rearranging terms produces Equation 2, which allows operators to estimate the pump’s ideal flow using the kilowatt (kW) load on the motor, the motor’s efficiency and the pump’s differential pressure. The ideal flow is the expected flow for a pump with 100 percent efficiency. To obtain an actual pump flow, an equation that relates the ideal pump flow to the estimated pump flow must be derived.
First, begin with the pump performance data in a tabular format (see Table 1).
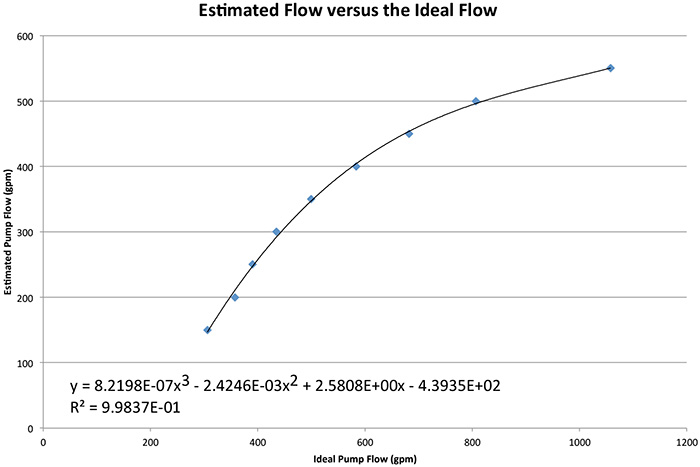
Next, create a column titled “Flow/Eff” with a calculated value of flow divided by efficiency, which will be called ideal flow. Using Excel, plot the flow (Q) versus the ideal flow (Q/ηp). Finally, insert a trend line with the equation for the relationship between flow and ideal flow.
Figure 1 shows a best equation obtained by plotting Q versus Q/ηp from the performance data. (In this case, a third order polynomial is used. The R2 value of 0.9983 indicates that there is an excellent fit between the data and the best fit equation.)
Figure 1. Plot of ideal versus estimated pump with best fit equation
To perform the complete flow calculation in the field, operators in the example needed a power meter to provide the true power to the electric motor driver, pressure transmitters on the pump’s suction and discharge, and a PLC to perform the calculations.
The PLC calculates the ideal flow using Equation 2, then uses the best fit curve equation to estimate the pump flow. If the estimated flow is below the minimum flow value, the PLC will return a low-flow reading and shut down one of the pumps. If the estimated flow is above the maximum value, the PLC will return a high-flow reading and start up one of the pumps.
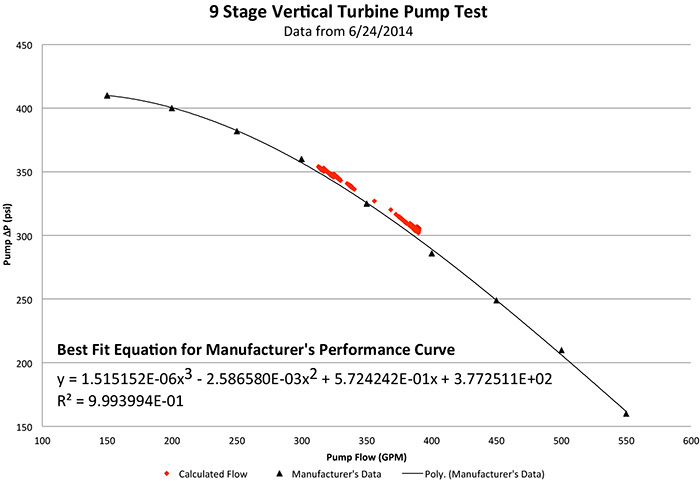
Figure 2. Comparison of manufacturer’s predicted performance versus the actual field data
Figure 2 shows calculated pump data (represented by red diamond data points) taken from the site and superimposed on the manufacturer’s performance curve. The data shows agreement between the calculated flow data and the pump performance curve.
Preliminary results prompted the team to continue with their plan of embedding this new pump flow algorithm into the overall pump control scheme. Because the ideal-flow-to-estimated-flow equations will change as the pumps degrade, a long-term strategy to handle calibration errors and internal wear must be put in place. The team will continue to look for chances to use the pump flow algorithm in place of a conventional flow meter to protect the pumps in parallel operation.
See other Maintenance Minders articles here.