Last of Two Parts

Part 1 of this series (Pumps & Systems, February 2016, read it here) examined the process elements of a piping system, as well as the flow rate, prior to troubleshooting the cause of pump cavitation. This column will use the piping system's data previously discussed and determine the cavitation's cause and other challenges within the system. In the example system (see Figure 1), results show that the differential pressure across the pump is only 63 pounds per square inch (psi), far less than the 69.2 psi in the validated results. The difference can be attributed to pump cavitation. The reduction in discharge pressure caused the level control valve to open farther to maintain the desired level in pressure vessel PX-PV-122.
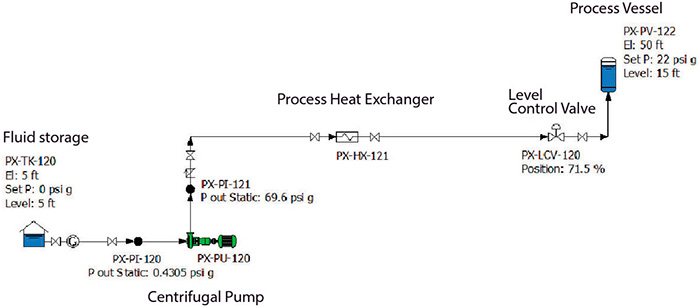
Figure 1. Example system consisting of the items making up the system along with displayed operating dataFigure 1. Example system consisting of the items making up the system along with displayed operating data (Graphics courtesy of the author)
We cannot use the pump curve to get the pump's flow rate, so to get an accurate reading we need a temporary flow meter. But because the level is maintained in PX-PV-122, we can assume the flow rate supplying the downstream loads meets the plant's process requirements of approximately 770 gallons per minute (gpm), the same as the validated results. Now that we know the pump is cavitating, we must determine the cause and solution. Based on the low pump suction pressure PX-PI-120, we can assume a greater head loss in the suction pipeline. This could be caused by increased flow rate in pump suction, but based on the ability to maintain a constant level in PX-PV-122, we can assume the flow rate is still 770 gpm. An obstruction in the suction pipeline could cause a head loss in the pipe in excess of the validated value, reducing the pump's suction pressure. The position of the supply tank discharge and pump suction isolation valves were found to be fully open, ruling out a partially closed isolation valve. The level reading in the supply tank was checked to ensure the low pump suction pressure was not the result of a low level condition in the supply tank. The normal operating level ruled out a low tank level. A pipe flange was discovered in the pump suction line. With other possibilities for a low suction pressure problem eliminated, the maintenance department put in a work order to remove the flange and look for obstructions in the suction pipeline. During the next scheduled shutdown, workers removed the suction flange and discovered two significant problems. First, they found a suction strainer in the suction pipeline that was not indicated on plant documentation. Second, the strainer contained parts of a broken spray nozzle and other debris causing blockage in the suction pipeline. When the team cleaned the suction strainer and reactivated the system, the pump suction pressure returned to normal, eliminating cavitation. Rather than removing the startup strainer, the maintenance staff decided to install a permanent strainer to protect the pump from large objects passing through it. A local differential pressure gauge was also installed to indicate fouling in the suction strainer. This piping system has been operating smoothly for an extended period of time, but recently the operations group has had problems getting sufficient fluid from the process vessel to the various plant loads supplied by the system. During periods of short-term high demand, the system cannot keep up with the rapidly changing process requirements. The current installed plant instrumentation results are displayed in Table 1 along with the normal valve position indicated in the validated results.
Table 1. A system having difficulty maintaining large demand changes Table 1. A system having difficulty maintaining large demand changes
The level in the supply tank appears to be at its normal level. The pump suction and discharge pressure gauges are in the normal expected range. The indicated level on the process tank is reading normal, but the tank's pressure is reading a steady 22 psi, indicating an increase of 2 psi above the normal value. Also, the control valve appears to be more open than normal. Because the pressure of the pump suction and the discharge pressure gauge are at their normal values, we can assume the flow rate through the pump is around 770 gpm, based on the validated results. Because the plant system can maintain the liquid level in the process tank under normal conditions, we can assume the flow rate through the pump and system is in the normal range. Because the flow rate does not appear to change, the dynamic head should remain constant. The liquid levels in the supply and process tanks appear to be normal, but the indicated pressure in the process tank is 2 psi higher than the normal value of 20 psi. This observed change is within the acceptable range of operation. This change in the pressure of the process tank increases the static head in the system. This increase in head on the process elements results in a lower differential pressure across the control valve, causing the control valve to open further. When cross-validating the results, we looked at the actual position of the control valve. Instead of the expected 70 percent, the control valve was 60 percent open. This discrepancy indicates a problem with the control valve or the static head value of the system. If there is erosion or wear between the valve disk and valve seat, the control valve needs to be closed more than expected to meet the flow conditions. After checking with the maintenance department, personnel discovered no work had been done recently on the level control valve. After checking with operations, the workers found the valve operated normally before the system had problems meeting the process requirements. The other potential cause for the control valve being closed more than normal would be a change in the system's static head. As indicated in Table 1, the tank levels were normal, and the pressure in the process tank was 22 psi, a value that did not vary. An operator was sent to the tank to check the local level on the sight glass and the pressure gauge attached to the process tank. The pressure gauge indicated 10 psi, 12 psi less than observed on the control panel. Discussions with the instrument department revealed that the process vessel's pressure transmitter connected to the plant's distributed control system was scheduled to be calibrated within the month. A follow-up discussion revealed the inoperative or failed position of the pressure transmitter occurred at 22 pounds per square inch gauge (psig). Based on the local operation and the failed position of the pressure transmitter, the indicated tank pressure was actually 10 psig instead of 22 psig. Over time, the process tank pressure decreased to 10 psi as indicated on the pressure gauge, but because the pressure transmitter was inoperative, the control loop showed 22 psi. Once the pressure transmitter was recalibrated, the tank pressure increased to the 20 psi set value, and the system provided sufficient flow to the process loads to meet its transient flow conditions.
See more Pump System Improvement articles by Ray Hardee here.

Issue