As global energy consumption continues to rise, greater burdens are placed on power generating infrastructure and the total cost of that energy. The pump industry reacted to these external market forces as manufacturers within the industry have innovated with new products and control systems. That’s the backstory behind a new, more precise and reliable methodology for measuring pump efficiency: true weighted efficiency (TWE). For those in the pumping industry, the external forces driving change begin at the U.S. Department of Energy (DOE). The agency found that pumps in industrial applications, such as heating, ventilation and air conditioning (HVAC); municipal water; chemical process and refinery applications account for as much as 20 percent of all energy consumed in the U.S., and their results launched a worldwide regulatory movement to reduce energy use.7 Similarly, smart fiscal practices within the pump industry provided motivation to look beyond the pump to the whole pump system. As the industry began to appreciate that life cycle operating costs should be a litmus test to evaluate pumping choices, we learned that 75 percent of lifetime expenses can be attributed to maintenance and energy costs. Thus, for regulatory and competitive reasons, the spotlight has fixed on pump or system efficiency. Efficiency, the numerical ratio between 0 and 100 percent, tells us which pump system consumes less energy at a single point. However, pumps operate at different condition points for different periods of time. How is pump efficiency measured in this case? TWE answers this question because it represents a true measure of overall pump efficiency for a specified pump working at many different operating points. TWE offers an easy, accurate and universally recognized methodology to compare energy efficiency. With broad and consistent use, this innovative metric will provide greater transparency of energy efficiency in the industry.
Background
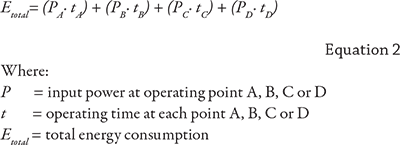
Most of us understand the significance and complexity of making optimal pumping selections that meet essential functional operating requirements.1, 2, 3 The process involves many factors including pump type, configuration, system design and operating control strategy.4, 5 Life cycle costing (LCC)—calculating the lifetime cost to purchase, install, operate, maintain and then dispose of equipment—has become a more common practice.6 For pumps operating continuously or for a significant portion of time, energy consumption represents the largest single cost. The energy consumption for a single operating condition with a constant input power, is calculated as follows: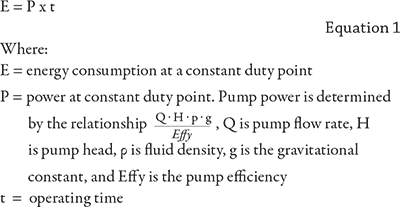 Most pumping systems, however, have a load profile defined by multiple operating conditions. These operating points occur at different head and flow conditions for a specified duration of time. The total system energy consumption for a representative load profile and four operating points is calculated as follows:
 While calculating the total energy consumption over four different operating points is more exact than comparing pumps based on a single duty point efficiency, this calculation is rarely performed.
In summary, pump efficiency remains the preferred measure, but no standard method exists for calculating it across multiple operating conditions.
While calculating the total energy consumption over four different operating points is more exact than comparing pumps based on a single duty point efficiency, this calculation is rarely performed.
In summary, pump efficiency remains the preferred measure, but no standard method exists for calculating it across multiple operating conditions.
Change Unfolds
Recently, various efficiency metrics designed to compare pumps with multiple operating conditions have emerged. The Ecodesign requirements for water pumps, EU Regulation No 547/2012, ushered in a minimum efficiency index (MEI) that facilitates comparisons at the best efficiency flow rate and at 75 percent and 100 percent of the best efficiency point (BEP) as well. The pump energy index (PEI), which applies to constant and variable speed pumps with multiple modes of operation, came about when the DOE introduced legislation requiring specific types of pumps sold in the U.S. to meet a minimum PEI benchmark. However, neither of these metrics qualify as efficiency values, nor can they compare pumps using an actual load case and system curve. An interesting approach known as the part load efficiency value (PLEV) was recently unveiled. The PLEV is a weighted average efficiency value inspired by the integrated part load value (IPLV), applicable to chillers and published in the Air-Conditioning, Heating and Refrigeration Institute (AHRI) Standard 550/590. The PLEV equation applied to pumps is:8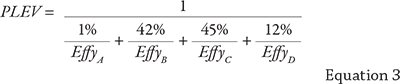 Point A corresponds to 100 percent of the duty flow operating 1 percent of the time. Point B represents 75 percent of the duty flow, 42 percent of the time. Point C is 50 percent of the duty flow, 45 percent of the time. Point D is 25 percent of the duty flow, 12 percent of the time. PLEV is thus a time-weighted average of the efficiency values, EffyA, EffyB, EffyC, and EffyD, at each operating point.
While a solid step forward, this formula only weights the pump efficiency based the proportion of operating time at each point. Since energy consumption is based on both time and power at each operating point, an improved weighting method is needed.
Point A corresponds to 100 percent of the duty flow operating 1 percent of the time. Point B represents 75 percent of the duty flow, 42 percent of the time. Point C is 50 percent of the duty flow, 45 percent of the time. Point D is 25 percent of the duty flow, 12 percent of the time. PLEV is thus a time-weighted average of the efficiency values, EffyA, EffyB, EffyC, and EffyD, at each operating point.
While a solid step forward, this formula only weights the pump efficiency based the proportion of operating time at each point. Since energy consumption is based on both time and power at each operating point, an improved weighting method is needed.
How TWE Is More Accurate
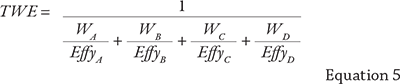
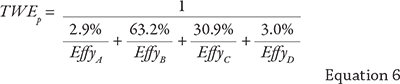
TWE weights the energy (power and time) at each operating point and therefore more accurately tracks multi-point energy consumption between various pumps using familiar and easily obtained efficiency values. This approach can optimize either pump energy consumption using pump efficiency values or total input energy consumption based on wire-to-water efficiency values. TWE is based on the fundamental efficiency calculation, which is the ratio of energy output versus energy input: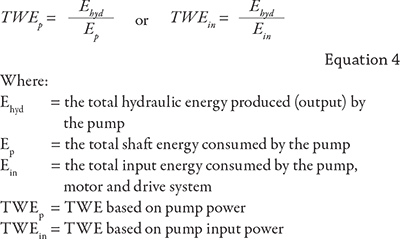 Equation 5 offers a more simplified version.
 Using the original time weighted factors in the PLEV formula, new sets of weighting factors emerge. Table 1 compares three different sets of weighting factors, or W. Each is based on a system curve passing through a static head value at zero flow (designated as Hsh0).
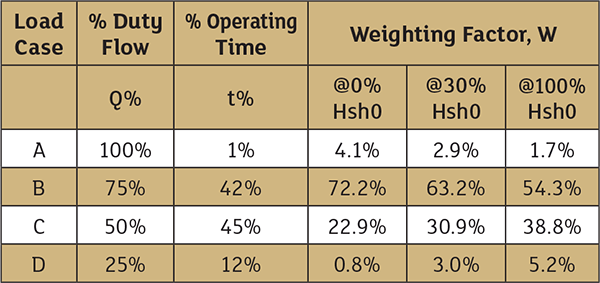 Table 1. TWE weighting factors for load cases A, B, C and D
 - at 0 percent static head (0 percent Hsh0) - a friction driven system curve with a zero-static head
- at 30 percent static head (30 percent Hsh0) - a typical system curve including a static head of 30 percent of the duty head plus a friction component
- at 100 percent static head (100 percent Hsh0) - a constant pressure system curve with the static head and all operating conditions equal to 100 percent of the duty head
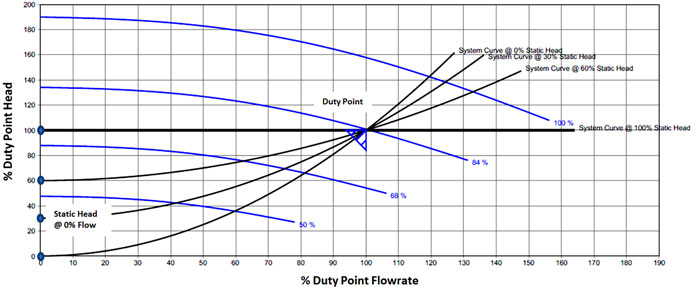 Figure 1. Variable speed pump performance intersecting system curves with static head of 0 percent, 30 percent, 60 percent and 100 percent of duty point head (Images courtesy of Intelliquip)
How it Works
Let’s walk through a numerical example.- 100 percent duty condition: Q100% = 230 gallons per minute (gpm); H100% = 54 feet
- Static head = 30 percent of H100% = 16.2 feet = 30 percent Hsh0
- Four operating conditions: A, B, C and D with flow rates of 100 percent, 75 percent, 50 percent and 25 percent with operating time of 1 percent, 42 percent, 45 percent and 12 percent respectively. This load case is identical to the time and flow weightings used in the PLEV formula.
- Pump operating with a variable speed
 Pump selection software was used to analyze hundreds of hypothetical simulations across a representative product line. For comparison purposes, two different sets of pump efficiency values are tabulated, described as Pump A and Pump B. Pump A had the better TWE of 73.4 percent compared to the TWE of 71.4 percent for pump B. This is reinforced by the fact that Pump A’s energy consumption is lower at 26.44 kilowatt hours (kW-hr) compared to 27.19 kW-hr for pump B, both with 24 hours of operation. The PLEV for pump A appears less favorable at 70.4 percent compared to 71.5 percent for pump B even though pump B consumes more energy. This is due to the unrealistically high weighting factors for operating points C and D in the PLEV formula.
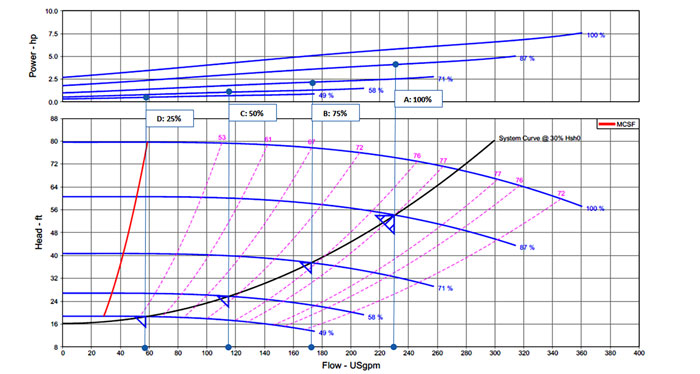 Figure 2. Pump A operating with variable speed at conditions A, B, C and D
 Summary
In recent years, external and internal forces have prompted the pump industry to seek more precise methods of measuring energy use at all operating conditions throughout the day. The TWE metric here will reliably depict an efficiency value at multiple operation conditions. It surpasses weighted average methods that do not consider total energy consumption and that omit different load profiles or operating modes. The TWE for any pump application scenario can be modeled and counted on to provide dependable comparisons between rotodynamic pumps operating at fixed or variable speed, on/off operation, throttle control or by-pass control; and positive displacement pumps.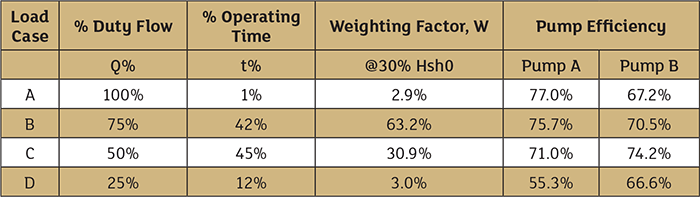 Table 2. Tabulation of pump efficiency values for Pumps A and B
 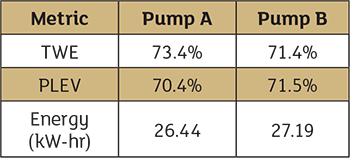 Table 3. Efficiency and energy consumption metrics for Pumps A & B
 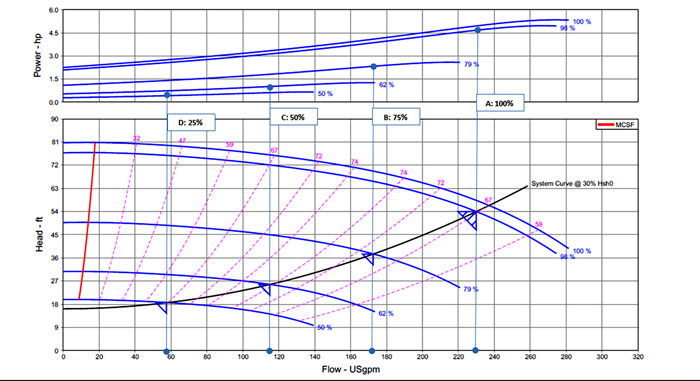 Figure 3. Pump B operating with variable speed at conditions A, B, C and D