Every pump industry professional faces the challenge of choosing the most efficient system for a particular application. This process is complicated by the uncertainties of efficiency regulations, mandates and parameters, especially when efficiencies alone do not tell the whole story. Sometimes the most efficient motor is not the best choice. By using two simple calculations, pumping professionals can determine the best motor\'97as well as the best pump and drive—for each application. To help both consumers and installers, nearly every product sold today features an energy cost or energy star rating. Industry standards and regulations developed by a coalition of industry experts help control these ratings, including multinational organizations such as The National Electrical Manufacturers Association (NEMA) and International Electrotechnical Commission (IEC).
 Image 1. Analyze both the capital expenditure and the total energy cost of the pumping system to identify the motor that is truly the most efficient for an application. (Images and graphics courtesy of Franklin Electric)
Step 1. Measure WWE
The first step is to measure true efficiency by analyzing the complete wire to water efficiency (WWE) of the pumping system (see Equation 1). WWE = [(motor efficiency) x (pump efficiency) x (control/drive efficiency)] x 100 Equation 1 One-hundred percent efficiency is impossible if any component within a system is less than 100 percent efficient. Consider the following examples. Example 1. 50-HP, 2 Pole (3,600 RPM) pumping system: The system has an 84 percent efficient motor, 45 percent efficient pump and 99 percent efficient control/drive. Its WWE is 37.42 percent (see Equation 2). (0.84 motor x 0.45 pump x 0.99 control/drive) x 100 = 37.42% WWE Equation 2 Example 2. 60-HP, 4 Pole (1,800 RPM) pumping system: This system has a 90 percent efficient motor, 76 percent efficient pump and the same 99 percent efficient control/drive. Its WWE is 67.72 percent (see Equation 3). (0.90 motor x 0.76 pump x 0.99 control/drive) x 100 = 67.72% WWE Equation 3 Every motor and pump manufacturer is required to publish full load efficiency data for standard rated products. Be aware of data accuracy, and note that Web- or app-based sources for efficiency ratings are generally updated more frequently than printed documents are. As the industry evolves, changes are inevitable. A subtle change has a multiplicative effect on total system efficiency. For this reason, end users should research the same efficiency data for pumps and controls/drives. When choosing the proper motor efficiency, users should be aware that most motors will have a full load (FL) and a service factor (SF) efficiency rating, which will depend on the load point from the pump. When selecting the load point, reference the total HP requirements needed. If the HP is at the rated full load point, use FL efficiency. If the load point is at the SF rating, use SF efficiency. The correct efficiency rating is as important as the total system efficiency. Most pumps will list a best efficiency point (BEP). To establish the pump efficiency, look at the head point on the efficiency curve (see Figure 1). Gather the control/drive details, and simply plug the data into the formula.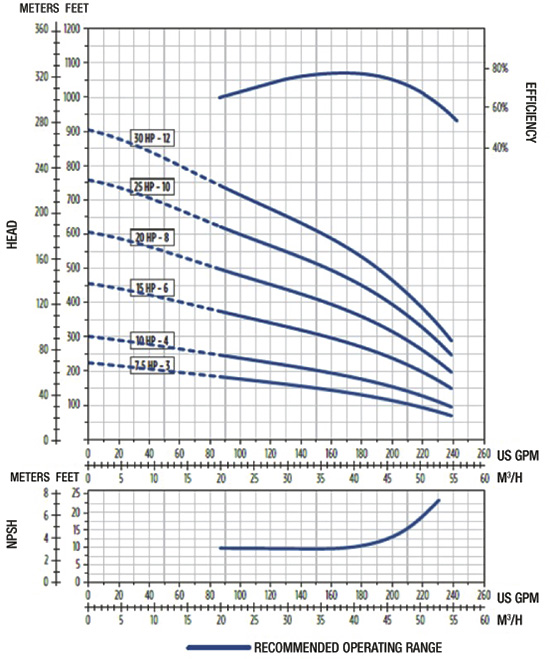 Figure 1. When analyzing pump efficiency, look at the head point of an efficiency curve rather than solely using the BEP that most pumps list.
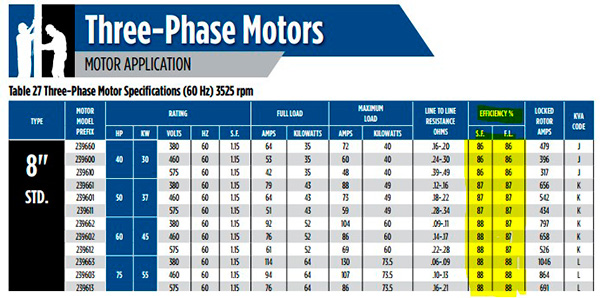 Figure 2. The Application, Installation & Maintenance Manual (AIM) manual is one of the many places that you can obtain accurate motor efficiency information. Product efficiency information from online resources are typically more accurate because they can be updated more frequently.
Step 2. Measure energy cost
The second calculation regarding efficiency determines energy cost. All power companies charge for kilowatt-hours (kW/HR). The rate varies by location and provider, so the following examples will use $0.20 per kW/HR. Regardless of whether an application is submersible or surface-mounted, motor speed and horsepower must be analyzed to determine kW/HR used. Whether a user is installing a submersible pumping system, a line shaft turbine or a centrifugal system, the calculations are the same. Note that the control/drive will have an efficiency point to include. This will provide the complete system cost. Examples 1 and 2 analyze energy cost using the same two pumping system examples from Step 1. Example 1. 50-HP, 2 Pole (3,600 RPM) pumping system: In the previous example, the system was 37.42 percent efficient. The motor consumes 49 kW/HR (50-HP motor from Figure 1) operating 24/7 for 30 days for a total of 35,280 kW consumed. At $0.20 per kW/HR, the power cost per month is $7,056 (see Equation 4). 49 x 24 x 30 = 35,280 kW/HR x $0.20 = $7,056 Equation 4 Example 2. 60-HP, 4 Pole (1,800 RPM) pumping system: This system seemed to be the clear efficiency leader at 67.72 percent efficient. The more efficient motor in a line shaft turbine system is four-pole (slower speed) but requires a 60-HP motor to generate the same head and flow. Again, operating 24/7 for 30 days, this motor consumes 62 kW/HR and 44,640 kW per month for a cost of $8,928 (see Equation 5). 62 x 24 x 30 = 44,640 kW/HR x $0.20 = $8,928 Equation 5 Image 2. The submersible motor shown here may actually be a more efficient option than a surface motor, depending on the pump and drive/control it is paired with.