
Choosing the sealing solution that will be the most cost-effective option for a particular application is not as simple as selecting the one that has the lowest one-time cost. To assist users in choosing the best seals, the Fluid Sealing Association (FSA) created a life-cycle costs (LCC) calculation tool that enables end users to compare solutions to determine which offers the lowest cost over the life of the pump. The FSA's LCC calculation tool allows users to compare additional considerations, including the annual operating cost of each sealing solution. The tool calculates the traditional elements, such as spare parts and labor, plus parasitic losses that are often overlooked. The LCC tool can determine these losses using standard engineering calculations and data from the user's inputs. Annual component considerations can be grouped as: Operating costs. These costs are items needed to support the sealing system such as cooling water, flush and quench fluids, buffer and barrier fluids, barrier gas, and/or effluent treatment. Equipment maintenance and repair costs. These are associated with the need to perform repairs and replace parts on the pump because of failure of the sealing solution. Seal maintenance and repair costs. These costs are associated with reconditioning the mechanical seal or replacing the packing rings, lantern ring and sleeve. Downtime and loss of production costs. This is the cost of lost production from the unexpected failure of the sealing solution, which affects the operation of an entire production unit Environmental costs. This is the cost of complying with environmental regulations for the particular sealing solution. An example includes monthly organic vapor analyzer sniffing of single seals. It could also include penalties and fines for fugitive emissions. Energy costs. This is the frictional power consumed by the seal or packing. It is also the pump heat soak, energy removed from the pump to reliably operate the shaft sealing solution. It also takes into account energy consumed in additional downstream processing.
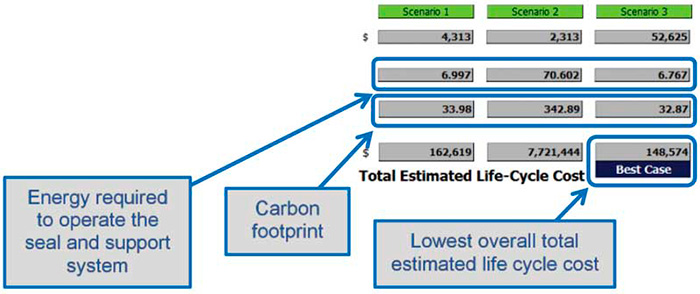 Figure 1. Summary of energy and life cycle costs (Graphics courtesy of FSA)
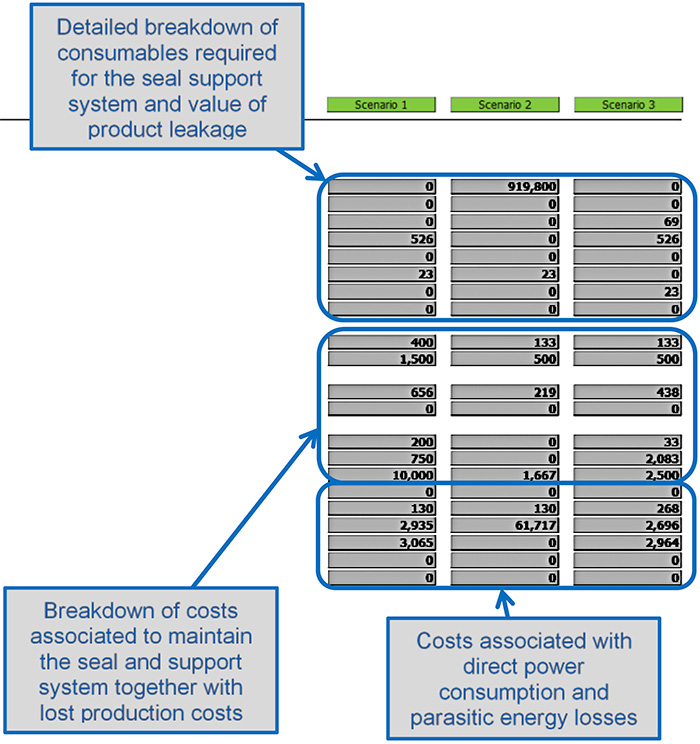 Figure 2. Detailed cost breakdown