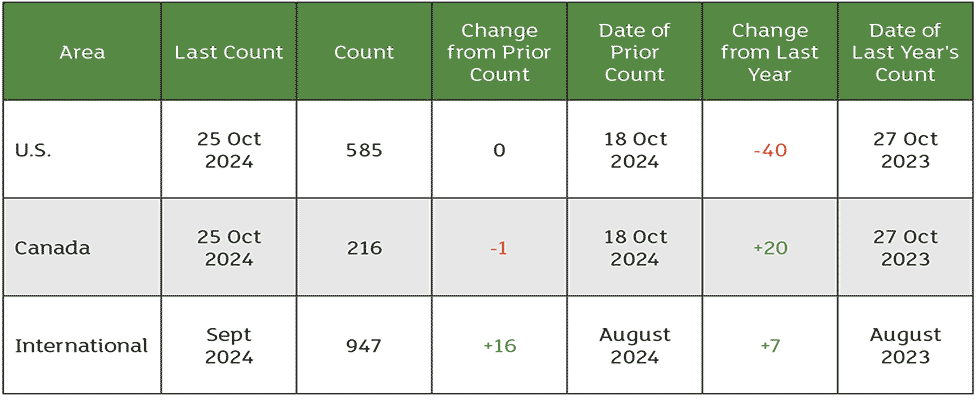
Above chart shows October rig count overview and summary count.
The United States Bureau of Labor Statistics reported the Consumer Price Index for All Urban Consumers (CPI-U) rose by 0.2% in September. Over the past year, the overall index increased by 2.4%. Notably, shelter and food were the main contributors to the monthly increase, with shelter rising 0.2% and food up 0.4%.
The energy index fell by 1.9% in September, following a 0.8% decline in August. Excluding food and energy, the index rose 0.3%, similar to previous months. Over the past year, the index for all items excluding food and energy rose 3.3%, while the energy index dropped 6.8% and the food index increased by 2.3%.
In September, total nonfarm payroll employment increased by 254,000, while the unemployment rate remained stable at 4.1%. Key sectors showing employment growth included food services, healthcare, government, social assistance and construction. The household survey indicated the unemployment rate and the number of unemployed individuals (6.8 million) changed little from August but were higher than a year ago. Long-term unemployment remained relatively unchanged, with 1.6 million people jobless for 27 weeks or more. The labor force participation rate held at 62.7%, and the employment-population ratio was stable at 60.2%.
Average hourly earnings for private nonfarm employees rose by 0.4% to $35.36, with a year-over-year increase of 4.0%. Additionally, revisions for previous months showed higher employment numbers for July and August, totaling an increase of 72,000 jobs compared to earlier reports. Overall, employment trends were positive despite the impact of Hurricane Francine.
In September, the Producer Price Index (PPI) for final demand remained unchanged, following a 0.2% increase in August. Over the past year, the index rose 1.8%. The stability in September resulted from a 0.2% increase in final demand services that balanced a 0.2% decline in final demand goods. Specifically, the index for final demand services advanced by 0.2%, with significant contributions from deposit services and various retail and transportation services.
In contrast, the index for final demand goods decreased by 0.2%, largely due to a 2.7% drop in energy prices, particularly gasoline, which fell by 5.6%. Despite this, prices for final demand foods increased by 1.0%. Overall, the index for final demand excluding foods, energy and trade services inched up 0.1% in September and rose 3.2% year-over-year.
U.S. import prices fell by 0.4% in September. This drop was primarily driven by lower fuel prices, which decreased by 7%, offsetting a slight increase in nonfuel prices, which rose by 0.1% for the third consecutive month. Fuel import prices saw significant declines, with petroleum prices down 7.1% and natural gas prices dropping 14.5%. Over the past year, fuel import prices decreased by 17.3%. In contrast, nonfuel import prices increased by 1.8% over the past year.
Prices for foods, feeds and beverages fell by 1.5%, largely due to a 12.2% decline in vegetable prices. Meanwhile, nonfuel industrial supplies and materials saw a monthly increase of 1.1%, led by higher prices for metals and chemicals.

