A common question asked by users of air operated double diaphragm (AODD) pumps is, “What is the maximum viscosity of a process fluid that can be transferred by an AODD pump?” In truth, the answer has little to do with the selected pump and much to do with the piping system to which the pump is connected. Users often forget this, since most AODD applications are transfer applications with a relatively low viscosity fluid. While a complete discussion of more accurate methods for evaluating pump systems is beyond the scope of this article, pump users can employ the following techniques to estimate the factors that impact flow rates in AODD systems with high viscosity fluids. Consider the following simple fluid transfer system in which the user wants to transfer 20 gallons per minute (gpm) using a 1-inch AODD. To determine if an application is possible, three questions must be answered:
1. Can the pump draw fluid at the desired flow rate through the suction line?
An approximate answer to this question can be found by comparing the pump’s dry-lift rating to the suction line loss. In other words, does the pump’s dry-lift capability exceed the suction line loss at the desired flow rate?2. Can the pump overcome the system’s total dynamic head (TDH)?
When considering AODD applications, it is beneficial to consider TDH in terms of pounds per square inch (psi) rather than feet of water (ft-H20) for the simple reason that the energy source for AODDs is compressed air. If the air inlet pressure exceeds the systems TDH, then fluid can be transferred in the pump system. For pump longevity, AODD users should strive to design systems that operate in the mid-range of the pump’s capabilities. No more than 60 psi of TDH is a reasonable design goal for most transfer systems.3. To what degree should the pump be derated, given the operating conditions?
Most manufacturers publish viscosity correction curves. The curves, in effect, summarize the frictional losses that occur when viscous fluid pass through the pump.Considering Question 1
To determine if the pump can draw in the process fluid, it is necessary to calculate the suction line loss for the desired flow rate. A discussion of the mathematics of suction line loss is too in-depth for this article. However, pipe diameter and flow rate impact line loss tremendously. It is not uncommon to increase the diameter of the suction line to overcome suction line loss. Consider the following results for suction line loss calculations in the example system in Figure 1.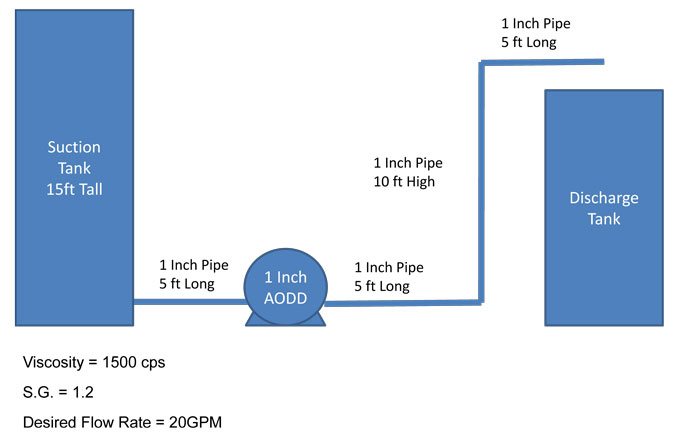 Figure 1. Example system (Images courtesy of All-Flo)
Considering Question 2
To calculate the TDH of the entire system, both the total static head and the discharge frictional line loss must be determined. See the example system in Table 1.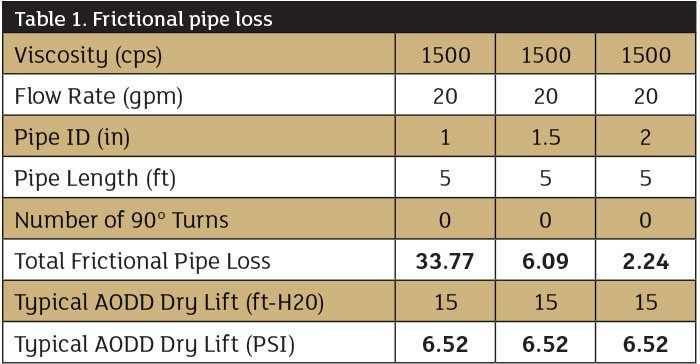 Table 1. Frictional pipe loss
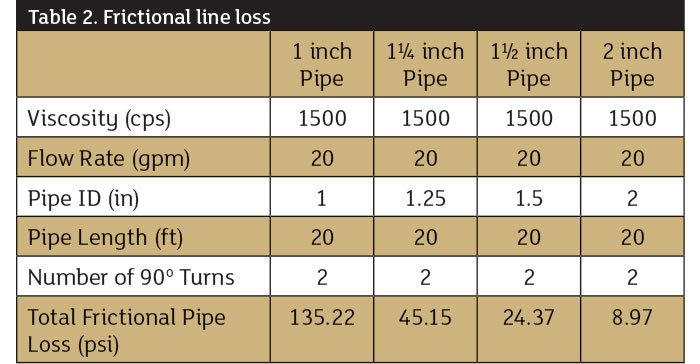 Table 2. Frictional line loss
Considering Question 3
The final step in the rough approximation is to consider the line losses as the process fluid moves through the pump. AODD manufacturers typically publish pump curves for water. Viscosity correction curves de-rate the pump’s capacity for process fluids with higher viscosities. For the example system, the manufacturer’s table advises that, with 1,500 cps, the pump will operate at 88 percent of its published capacity. When reading the manufacturer’s published curves one should therefore read 20 gpm at 23 gpm (20 gpm/0.88). Referring to the adjusted example system, two changes were made—suction line diameter increased to 2 inches and discharge line diameter increased to 1.5 inches. Finally, we must determine the air-inlet pressure of the AODD. Figure 2 is a typical example of a published pump curve from an AODD manufacturer. The horizontal axis typically represents the flow rate in gpm or liters per minute (lpm), and the vertical axis typically represents both system pressure and air operating pressure.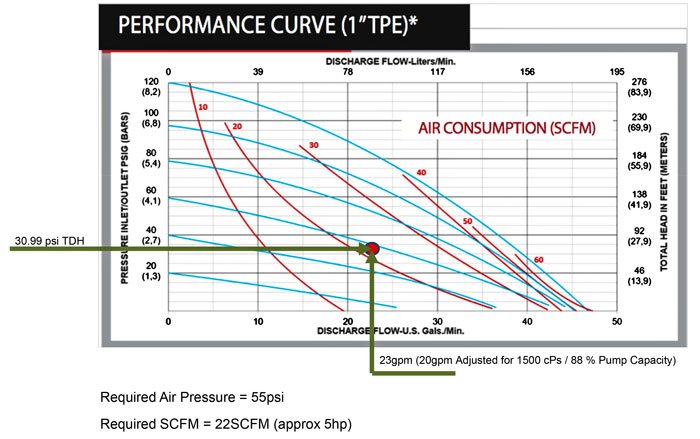 Figure 2. Typical published performance curve