There are two fundamental issues with pumps operating not at, or near to, best efficiency point (BEP): low reliability (things just break), as well as excessive energy consumption (somebody pays much more). Reliability impact—low efficiency, high radial loads, noise, vibration—becomes a real problem when that happens. Damage to the seals, bearings, shaft, couplings and poor reliability are a direct result of such operation. But let’s explore the effect of such operation on pump efficiency, and we will estimate wasted energy. The larger the pump, the more energy is wasted when a pump operates off-peak. A full range of American National Standards Institute (ANSI) pumps, for example, as offered by a pump manufacturer, may consist of many sizes to span a wide range of flows, with larger sizes reaching more than 4,000 gallons per minute (gpm). Image 1 is an overall hydraulic coverage chart. For each size, a head-capacity curve at the maximum and minimum impeller diameter is plotted (sometimes minimum diameter is not shown in order to make the chart less cluttered). This allows us to make an approximate selection of a pump size, and then to look up the individual detailed hydraulic performance curve for that size to finalize the details.
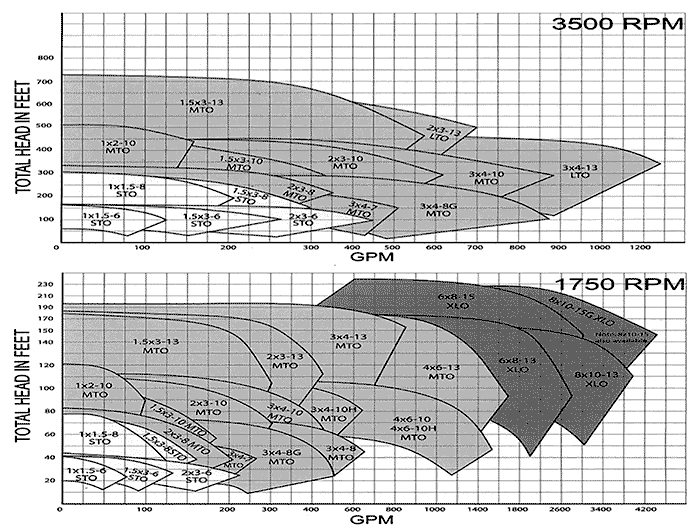 Image 1. Overall hydraulic coverage chart (Images courtesy of ITT Goulds)
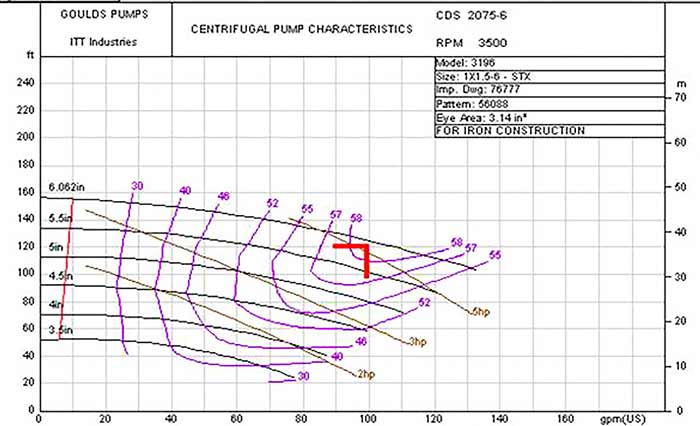 Image 2. Pump curve of a small pump (Images courtesy of ITT Goulds)
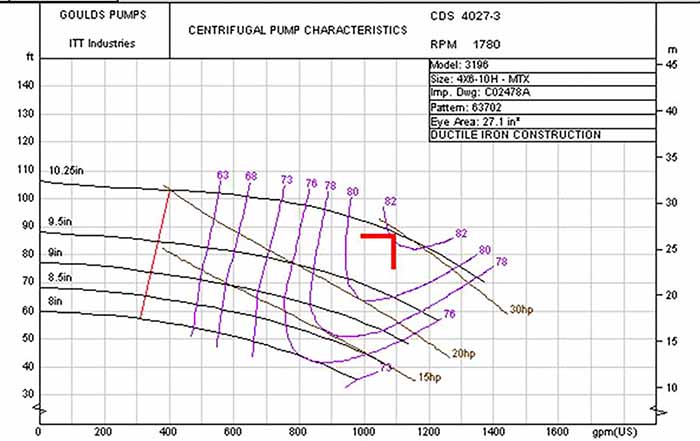 Image 3. Pump curve of a 4X6-10H pump. (Images courtesy of ITT Goulds)
 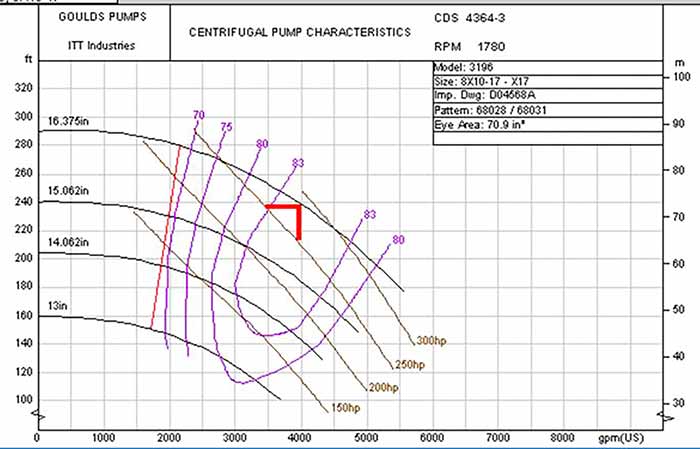 Image 4. Pump curve of an even larger pump (Images courtesy of ITT Goulds)