Pump manufacturers should prepare for the changes that the impending regulations will bring, including possible design improvements.
01/22/2014
Second of three parts. Part 1 was featured in the January 2014 issue of Pumps & Systems. View part 3 here.
This is the second part of a three-part series that discusses the upcoming U.S. Department of Energy (DOE) pump efficiency regulations and how the Hydraulic Institute (HI) is working with HI members, the DOE and other groups to reduce the burden on U.S. pump manufacturers, while supporting DOE efforts to achieve energy savings and efficiency improvements in the marketplace.
During its February 2013 annual meeting, HI members formulated a consensus on the more than 130 technical and market-based questions raised by the DOE that was presented at the framework hearing in Washington a week later. A 465-page transcript of the proceedings, along with HI discussions, is available on the DOE rulemaking website. HI’s written response is also available at www.Pumps.org/DOERulemaking.
More recently the DOE launched a parallel “negotiated rulemaking” process under the Appliance Standards Rulemaking Advisory Committee (ASRAC), which first met in Washington, D.C., on Dec. 18 – 19, 2013. A group of HI members has been appointed to the ASRAC working group on pumps, along with other members who represent energy efficiency advocates, electric power utilities, DOE staff and an end user. A schedule of public meetings was established that run through July 2014. HI will provide updates to its members, and also post progress reports on www.Pumps.org/DOERulemaking as new information becomes available.
MEI Basis
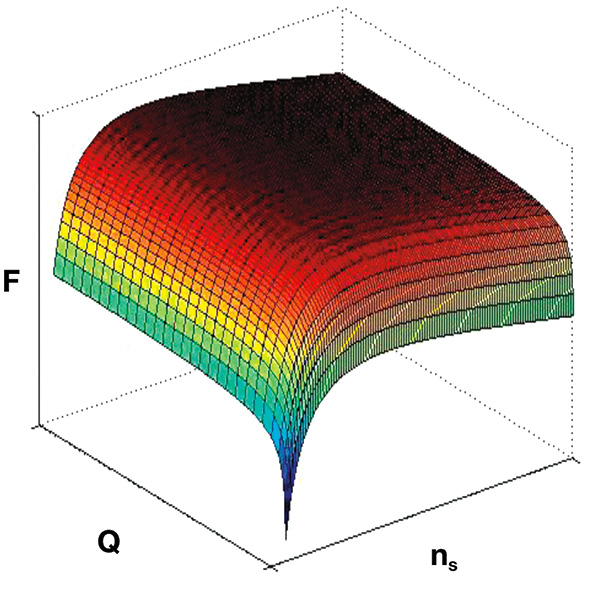
To reduce the burden on pump manufacturers while addressing pump efficiency, HI recommended that the DOE adopt a Minimum Efficiency Index (MEI) that is central to the European Union (EU) 547/2012 Standard as proposed in EU Lot 11. HI advocated to the DOE that “the MEI equation should be used with the EU coefficients for a, b, c, d, and e as set forth in the Department’s framework document (Appendix C, p. 110, p. 116, et al.), remaining consistent with the EU Directive, but with updating the EU’s coefficient, C and the Department’s coefficient, f (equivalent to the C value in EU regulations) to reflect the proper efficiency cutoff values that result in specified minimum efficiency thresholds, based on HI’s more current data.” In a survey conducted by HI with 17 member companies soliciting data on 2,124 pump models, the resulting database is roughly statistically equal to the size of the EU database used to create the EU Lot 11 Standard (2,390 pumps) (Europump study). The European database served as the basis for the equation that is the backbone of the MEI Standard. The equation describes a three-dimensional (3-D) quadratic surface, representing the minimum efficiency threshold of pumps that can be sold in the EU market. Minimum efficiency thresholds (ηBot) are established using the same equation as developed for the EU pump efficiency regulation: ηBot = -11.48x2 – 0.85y2 – 0.38xy + 88.59x + 13.46y – C Figure 1. 3-D plot of the MEI equation
- Places significantly greater regulatory burdens on U.S. pump manufacturers
- Restricts export opportunities to markets and countries that adopt the EU standard and/or regulation
- Creates increased compliance issues for imported pump products that are subject to different efficiency metrics while only serving to disadvantage U.S. pump manufacturers and their global competitive position
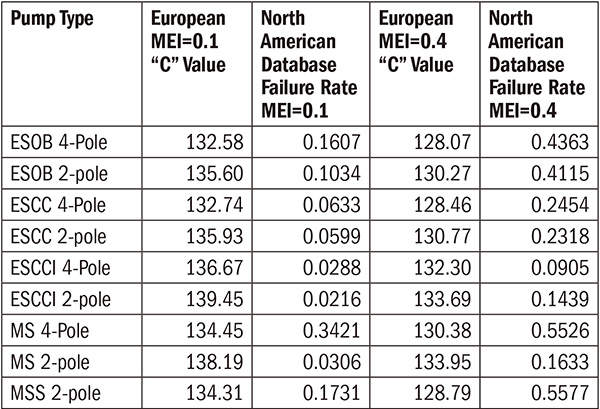
 Table 1. North American pump MEI failure rates using European C values
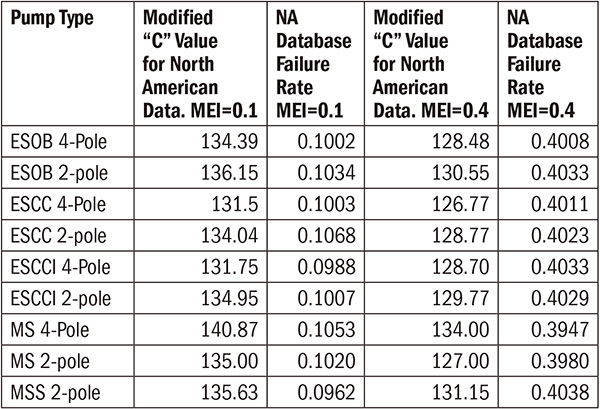
 Table 2. North American pump MEI failure rates using modified “C” values
.jpg) Table 3. Difference in MEI threshold efficiencies using modified C values in North America versus the EU C values
Table 3. Difference in MEI threshold efficiencies using modified C values in North America versus the EU C values
