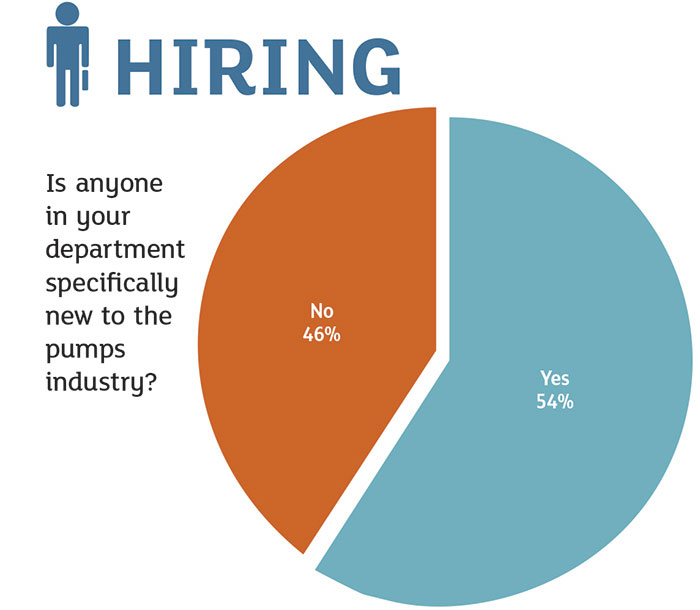
Is anyone in your department new to the pumps industry? What type of pumps training did you receive in college? How long have you been in the industry? These are just a few of the questions we asked Pumps & Systems readers to weigh in on for our first annual Industry Employment Analysis. In the following pages, we highlight data ranging from health benefits to the most popular products in the marketplace. We’ve heard from industry leaders and readers like you that recruitment and workforce training are among the most critical issues the industry must address moving forward, so we’ve also included data on employee retention and pumps education. We hope this data—culled from several Pumps & Systems reader surveys and data from the Hydraulic Institute—will be helpful to you and your company.
Hiring
The difficulty of recruiting young workers to the pumps industry is an issue echoed in both our reader surveys and discussions with industry leaders. Despite these concerns, there are many up-and-coming employees who are committed to making a career in the industry. Irene País’s story is the first installment of a five-part Pumps & Systems series highlighting some of the bright young people taking on pumps careers in 2017. Read other parts of this series here. Irene País
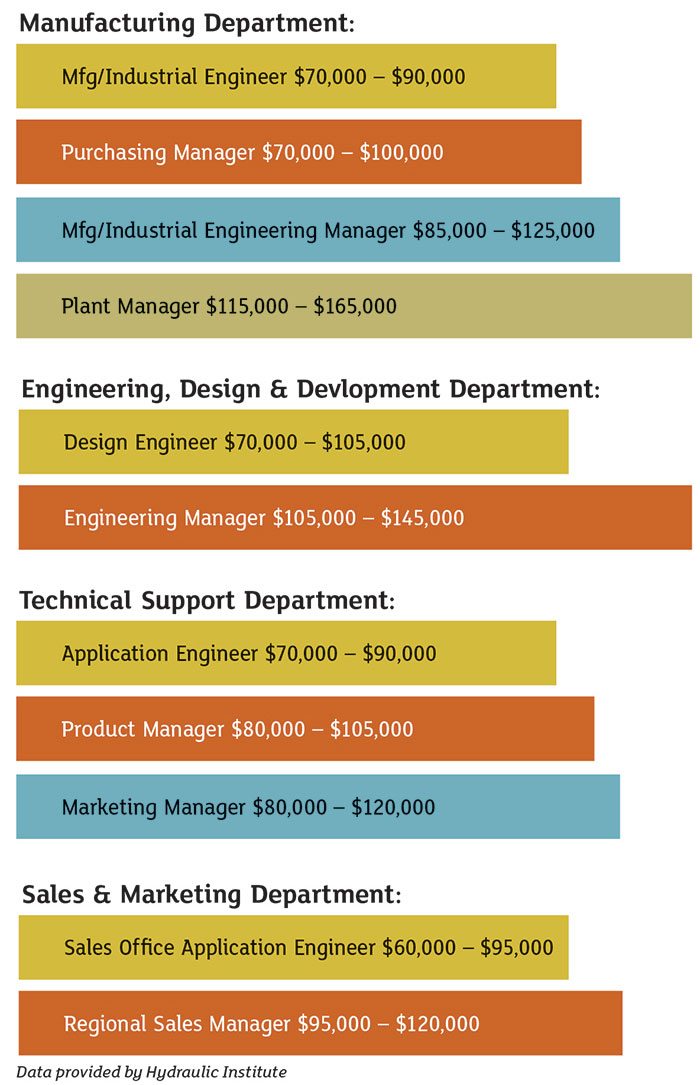
Salaries
In today’s competitive job market for highly skilled positions, it’s essential that a company’s compensation package be designed to attract and retain key employees. To address this need, the Hydraulic Institute conducts an annual salary survey of U.S. pump manufacturers and issues a detailed salary report to participating members. The report covers 36 key positions in the manufacturing, engineering, technical support, administration, and sales and marketing departments. Salary figures given in the report include the average base salary as of January 1, minimum and maximum salaries, the first, second (median), and third quartiles, and whether the position was typically eligible to receive incentive compensation. Also shown in the report are the minimum, average and maximum incentive compensation for each job title and the average salary percentage increase. Salary figures range widely and are dependent on many factors, including years of experience in the job and the part of the country where the employer is located. To effectively benchmark your compensation package against others, take each influencing factor into consideration. That’s why, for each job title in HI’s Annual Salary Report, base salaries are broken out by annual sales volume, geographic region, city size of the reporting company’s primary plant, number of full- and part-time salaried employees, and number of years in that position. It’s this level of granularity about positions in the pump manufacturing industry that makes the report uniquely valuable as a planning and budgeting tool. The information to the right highlights some of the positions covered in the report using salary figures from 2016. Where you see that a regional sales manager’s annual base salary is in the range of $95,000 to $120,000 the report would tell you, for example, the average salary for a regional sales manager in pump manufacturing companies with more than $100 million in sales, whose plant is located in the northeastern U.S., in a small city, in a plant with more than 150 salaried workers, and for individuals with more than 10 years of experience on the job. That level of detail about jobs in the pump industry is not available elsewhere. The Annual Salary Report is part of HI’s overall statistics program and is offered at no cost to participating members. For more information contact Mary Silver at msilver@pumps.org or visit the membership section at www.pumps.org.