These devices can detect problems and provide information needed to improve efficiency and save money.
Endress+Hauser
08/07/2017
Companies incur thousands, if not millions, of dollars in maintenance costs to keep their pumping systems in good health. Predictive maintenance is one of the best ways to cut pump operating costs. One effective predictive maintenance technique uses an electronic differential pressure transmitter to not only monitor instantaneous pump performance, but also to identify issues related to pump health and efficiency.
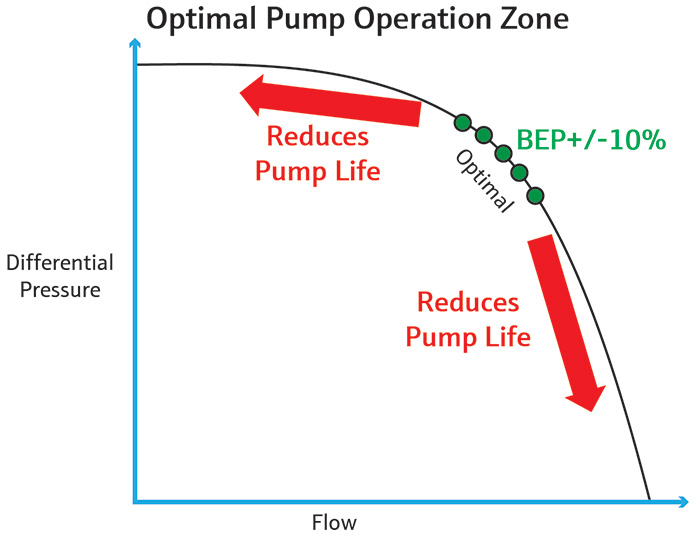 Figure 1. The BEP is 70 to 85 percent of the maximum differential pressure between the suction and discharge pressure. (Images and graphics courtesy of Endress+Hauser)
Monitoring Differential Pressure
All pumps perform best when they are at, or very close to, their best efficiency point (BEP) (see Figure 1). The BEP is defined by the manufacturer on its pump curve and is typically 70 to 85 percent of the shut-off head or maximum differential pressure between the suction and discharge. Operating at the BEP is the single most important aspect for prolonging pump life and cutting maintenance time and costs. An electronic differential pressure (EdP) transmitter is well suited for monitoring the performance of a pump in applications where continuous operation is critical, such as cooling tower systems or aeration pumps in wastewater treatment.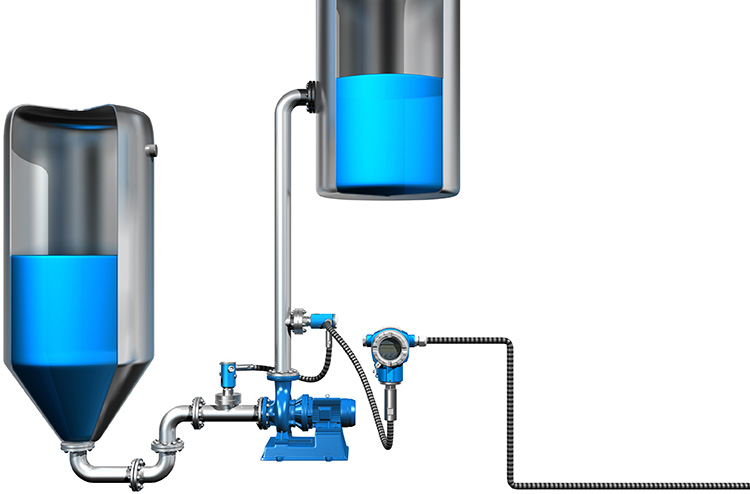 Image 1. An EdP transmitter monitors a pump’s suction and discharge pressure.
Setting the Right Flow Rate
Incorrect flow rate settings are one of the typical causes of inefficient pump operation. Following is an example of how to use the EdP to set the right flow rate. For a given pump curve, first note: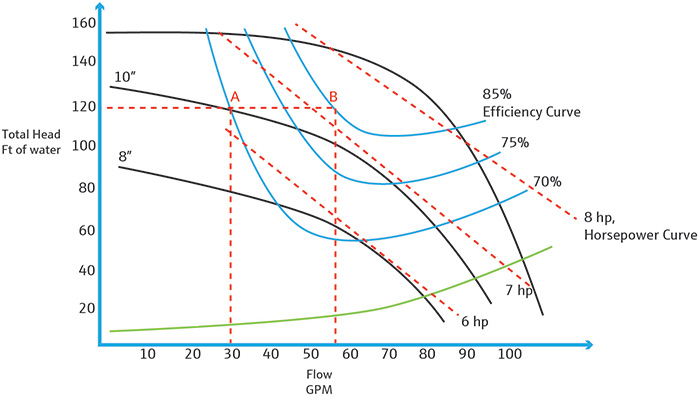 Figure 2. Pump curve for determining flow rate of a pump with a 10-inch impeller.
- impeller size
- rated horsepower
- impeller speed
- expected flow at BEP
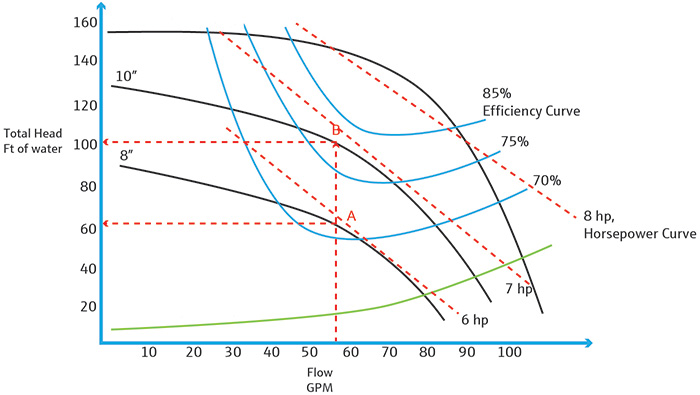 Figure 3. Pump curve for monitoring total head.
Monitoring Total Head
Assume 55 gpm is the operating flow rate for a 6 HP pump with an 8-inch impeller. The expected intersection on the performance curve for this pump would be point A (see Figure 3). The corresponding expected total head on the Y-axis would be 65 feet.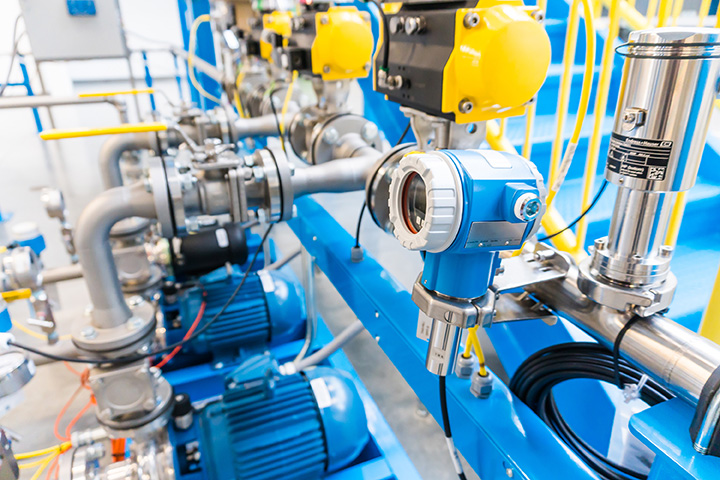 Image 2. An EdP differential pressure transmitter mounted across a pump.
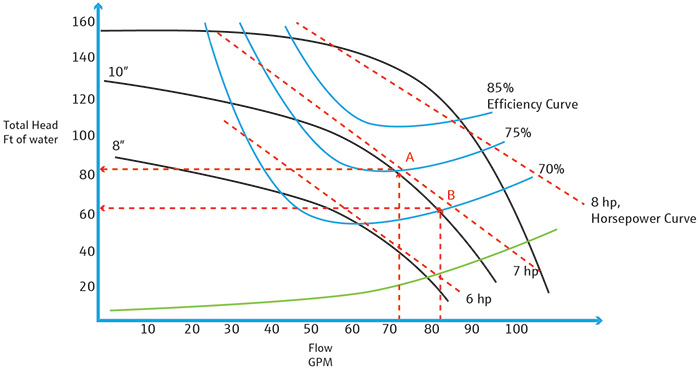 Figure 4. Increasing efficiency from 70 to 75 percent on five pumps can save over $12,000 per year.