Comprehensive testing revealed unexpected relationships.
05/21/2015
Rotary positive displacement (RPD) pumps theoretically displace a fixed amount of fluid per revolution. However, some loss in output is typically caused by the fluid slipping past the rotors. The difference between the quantity displaced (Qd) and the actual output quantity (Q) is slip (Sq). The volumetric efficiency of RPD pumps depends on the percentage of slip to the total quantity displaced. The total output quantity as a percentage of the quantity displaced is the pump's volumetric efficiency. The principle determinants of slip in the normal range of a pump's operation are:
- Viscosity—The higher the viscosity (V), the lower the slip.
- Pressure—The higher the differential pressure (Pd), the higher the slip. Pressure increases slip in pumps with flexible or compressible parts, such as flexible vane impellers or rubber coated lobes, more than in pumps with parts constructed of rigid materials such as steel.
- RPD pump type—Each pump type has different clearance requirements. For example, flexible vane pumps do not require any vane clearance whereas a rotary lobe pump with stainless steel lobes does require clearance from the housing. Within a pump type, some manufacturers are better able to meet tight clearance requirements with precision than others.
- Wear—As components wear, the clearances between them increase. At higher pressures and lower viscosities, this clearance difference may increase slip significantly.
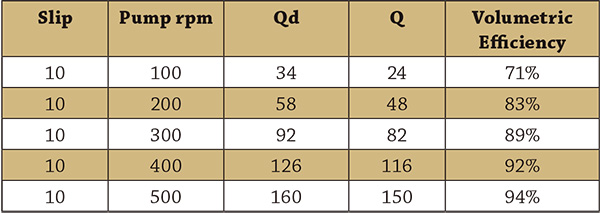 Table 1. Pump volumetric efficiency (Graphics courtesy of LobePro Rotary Pumps)
Testing High-Viscosity Fluids
A manufacturer of rotary lobe pumps (positive displacement rotary pumps) produces pumps equipped with nitrile rubber (NBR) coated lobes, although some are hydrogenated nitrile butadiene rubber (HNBR), fluorocarbon (FKM) and solid metal lobes. For many years, the manufacturer tested each pump in a test pond to ensure the pump met the published curve for flow and horsepower at the duty point for pumping fresh water, which is close to a viscosity of 1 centipoise (cP). However, through 2013, this manufacturer had not tested the pumps to determine the effect of higher viscosities on output and horsepower (HP) in part because many of its customers were unable to supply the viscosities of their fluids. For example, municipal sludge's viscosity depends on the temperature, percentage of solids, sludge type and how long the sludge has been stationary. The slip and HP required to move municipal sludge are typically estimated from practical experience based on the type of sludge and percentage of solids. With time and experience, however, many end users can provide the minimum and maximum viscosities of their fluids. Up to 2013, the manufacturing team estimated the effect of viscosity using Equation 1.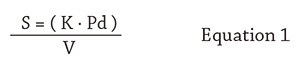
Test Results
The test team kept careful track of the barometric and water temperature throughout the testing process. However, when the team members conducted regression analysis of the data, these variables were not significant. The barometric pressure ranged from 29.86 to 30.22. The fluid temperature ranged from 12 to 22 C. As the team expected, with the tested pump rotating at 300 rpm with a differential pressure of 1 psi, the slip is relatively low, regardless of the viscosity. However, a small but steady increase in slip occurred from 2.6 percent displaced quantity at 1 cP to 8.2 percent displaced quantity at 207.9 cP, which was not expected. The team also determined slip at 25 psi differential pressure at different viscosities. At 1 cP, the slip equaled 24.5 percent of the displaced quantity, which was the maximum slip percentage. The test showed a steady decline in slip as the percentage of this maximum as the viscosity increased (see Figure 1). At 401 cP, the slip was 2.8 percent. The change in viscosity explained 95.2 percent of the change in slip.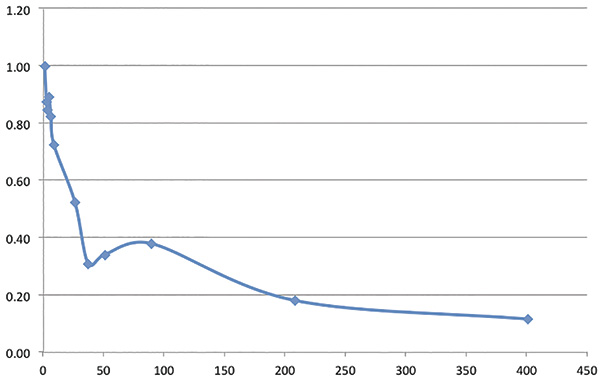 Figure 1. Slip percentage of the maximum quantity at 25 psi
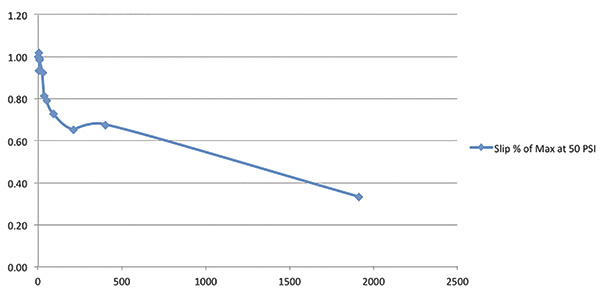 Figure 2. Slip percentage of the maximum quantity at 50 psi