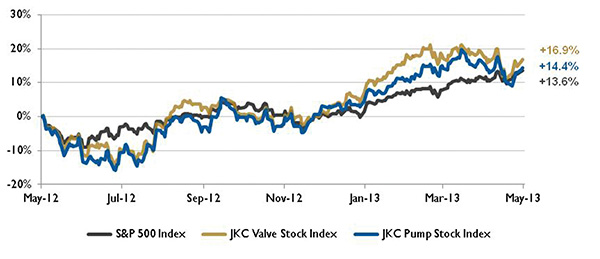
The Jordan, Knauff & Company (JKC) Valve Stock Index was up 16.9 percent during the last twelve months, above the broader S&P 500 Index which was up 13.6 percent. The JKC Pump Stock Index was up 14.4 percent for the same time period.1
 |
Figure 1. Stock indices from May 1, 2012, to April 30, 2013 |
Source: Capital IQ and JKC research. Local currency converted to USD using historical spot rates. The JKC Pump and Valve Stock Indices include a select list of publicly-traded companies involved in the pump and valve industries weighted by market capitalization.
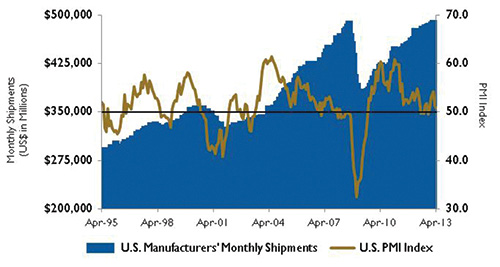
In April, the Institute for Supply Management’s Purchasing Managers’ Index (PMI) registered 50.7 percent, a decrease of 0.6 percentage points from March’s 51.3 percent. This reflects expansion in manufacturing for the fifth consecutive month but at the lowest rate of the year. When the PMI is more than 42.2 percent during an extended period of time, it generally indicates that the overall economy is expanding. The April PMI represents overall economic growth for the 47th consecutive month. The Employment Index fell from 54.2 to 50.2 percent suggesting that job growth is essentially flat.
The JPMorgan Global Manufacturing PMI showed expansion for the fourth straight month with a reading of 50.5 percent in April. However, the rate of expansion decelerated, meaning that growth in 2013 has been marginal. Only Japan, South Korea, Indonesia and Vietnam reported a faster rate of improvement in operating conditions during April. With the Euro area contracting at the fastest pace year-to-date and the U.K. stagnating, Europe remained a drag on the global aggregate. U.S. PMI showed the slowest growth in six months, and neighboring Mexico expanded at its weakest pace in 20 months. Manufacturing growth also slowed to near-stagnation in Russia, China, India and Brazil, while expansion rates fell in Taiwan and Turkey.
 |
| Figure 3. U.S. PMI Index and Manufacturing Shipments Source: Institute for Supply Management Manufacturing Report on Business® and U.S. Census Bureau. |
The U.S. Energy Administration (EIA) projects that world liquid fuels consumption will be higher during the next two years because of a moderate recovery in global economic growth. As new refining capacity continues to grow and investment in the property market and infrastructure sectors expand, China’s refinery crude oil inputs are expected to increase. The EIA estimates that liquid fuels consumption in China increased by 380,000 barrels per day (bpd) in 2012, will increase by 450,000 bpd in 2013 and 470,000 bpd in 2014. This is still lower than the average annual growth of about 520,000 bpd from 2004 through 2012.
 |
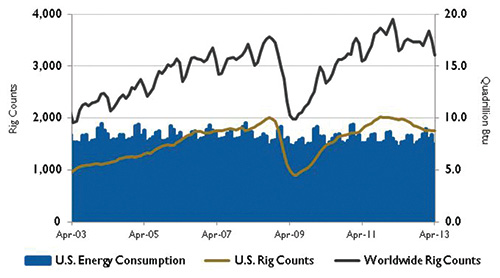
| Figure 2. U.S. Energy Consumption and Rig CountsSource: U.S. Energy Information Administration and Baker Hughes Inc. |
On Wall Street, the three major indices gained almost two percent each in April based on better-than-expected domestic economy news. The S&P/Case-Shiller Home Price Index 20-City Composite, the leading measure of U.S. home prices, showed the average home price increased 9.3 percent during the 12-month period ending in February 2013. The Conference Board reported that its consumer confidence survey spiked to 68.1 percent in April, following an upwardly revised 61.9 percent in March. P&S
Reference
1 The S&P Return figures are provided by Capital IQ.
These materials were prepared for informational purposes from sources that are believed to be reliable but which could change without notice. Jordan, Knauff & Company and Pumps & Systems shall not in any way be liable for claims relating to these materials and makes no warranties, express or implied, or representations as to their accuracy or completeness or for errors or omissions contained herein. This information is not intended to be construed as tax, legal or investment advice. These materials do not constitute an offer to buy or sell any financial security or participate in any investment offering or deployment of capital.

