Vertical pumps are used in many applications where limited surface area is available and a smaller footprint is required. When these pumps run smoothly, they provide long-term operation. When problems do occur, diagnosing the problem can be challenging. Electrical signature analysis (ESA) identifies faults in rotating equipment that present challenges with other technologies. This case study shows how ESA was used to identify issues in two cooling water pumps with 30-foot shafts in a commercial nuclear power plant.
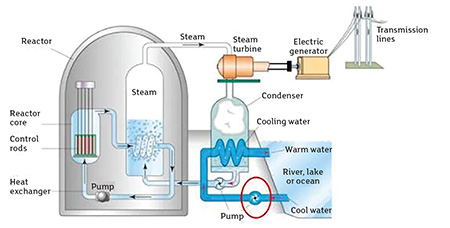
Cooling water pumps cool the condensed steam from the steam turbine. The condensed steam or condensate is then fed to the high-pressure pumps that circulate water through the steam generator in many nuclear power plants. The steam generator is a heat exchanger that converts feedwater to the steam required to turn the steam turbines that drive the generators that produce electricity.
Vertically mounted pumps are being used to reduce the mounting surface area while providing the wide range of operation required to produce the head necessary for the high-pressure feed pumps. These pumps can have a long life span, however, when a problem does occur, it is difficult to diagnose using conventional technologies such as machinery vibration analysis (MVA).
Two of the four pumps in question experienced issues. The maintenance team conducted machinery vibration, pressure and flow tests, and contracted Bob Dunn of I&E Central in Pittsford, New York, to perform power quality and ESA on the two 350-horsepower (hp), 480-volt motors driving the pumps using a motor analyzer/power quality analyzer.

The Electric Power Research Institute (EPRI) (NP-5704M) and Mechanical Technology Inc. conducted a study regarding vibration monitoring of vertical pumps in the late 1980s that highlighted the confusion with MVA. The study’s conclusion was that “in order to detect the early onset of pump problems, it is necessary to mount vibration sensors in the submerged (wet) portion of the pumps.” There were no sensors mounted in the wet portion of the pumps, and so vibration data taken from the motor combined with the flow and pressure studies provided no clues as to the cause of the performance issues.
How ESA Works
ESA uses the motor as the transducer to identify faults in the entire motor system. ESA connects current probes and voltage leads to the motor’s input supply leads and performs several tests. ESA performs a simultaneous data capture of all three phases of voltage and current for power quality analysis, captures a live time display of all three phases of voltage and current waveforms for a visual display, and performs an analog to digital (A/D) conversion of the motor’s voltage and current live time signals for input into the ESA. This information is used to create the displays, graphs and tools required for a complete fast Fourier transform (FFT) analysis of the motor.
The motor’s current acts as a sensitive transducer that identifies mechanical, electrical or hydraulic issues within the system starting with incoming power, the motor, the driven machine and any anomalies in the process itself. The motor analyzer software collected and transmitted the data via Bluetooth, allowing Dunn and the maintenance team to remain a safe distance from energized equipment.
Power Quality
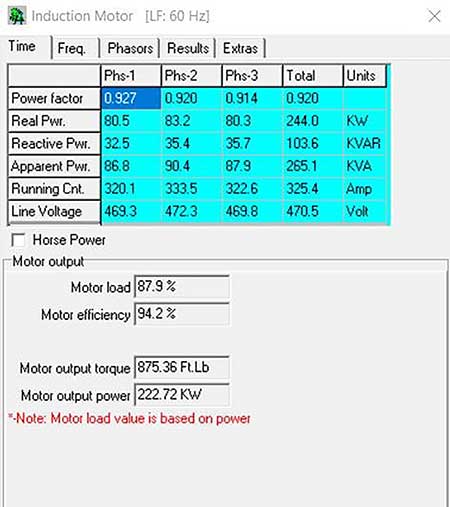
The power quality table (Image 2) establishes all voltages, current and power are balanced and within normal range, producing 87.9% load, indicating good power quality.

Electrical Spectrum
Both the low- and high-frequency current spectral data confirm there were no electrical or mechanical issues relating to the operation or the rotation of the motors or the pumps with the performance issues. This was consistent with the vibration and the flow and pressure tests.
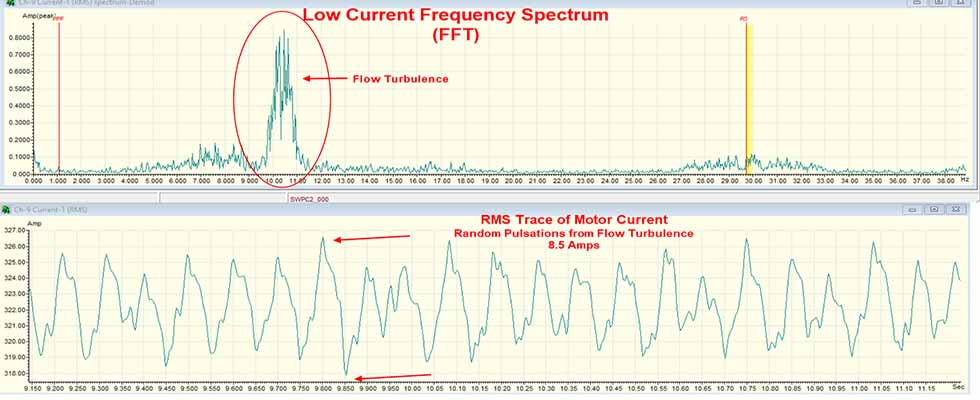
However, the expanded display of the root mean square (RMS) current trace shows current modulation of approximately 8.5 amps. The accompanying low-frequency spectral display from the FFT reveals broadband peaks in the demodulation spectrum at around 10 hertz (Hz). The spectral peaks at these frequencies are normally caused by pulsations or nonlaminar flow in the fluid system.

Once ESA determined that the root cause of the performance issues was flow related resonance (FRR), it was determined that the FRR was caused by flow dynamics in the lake supplying the cooling water. Adjustments to the operations of the pump combinations were made to not operate the affected pumps when the specific conditions that caused the problem existed. These procedures allowed the plant to meet the nuclear power plant’s performance requirements. During the ESA testing it was also discovered that two of the pumps had alignment and foundation issues.
Most plants are aware of using ESA to determine power quality or for identifying faults in electrical equipment, but users are surprised at its ability to identify mechanical faults in the driven equipment or any anomalies in the operation or the process itself. The speed at which ESA identifies anomalies makes it an excellent tool for the detection, as well as the analysis phases, of predictive maintenance programs. It is not limited by the frequency limits associated with vibration and ultrasonics, line of sight and emissivity with thermography. As discussed above, it also provides advantages in identifying faults in locations that are difficult to locate with sensors due to inaccessibility, environmental or safety issues.
Since ESA uses the electrical equipment voltage and current as the indicator of faults, anomalies or any other issues, it provides measurements of all the variables required to determine efficiencies, demand and load. Since it does not rely on Newton’s second law (F = ma) to create the measurable motion required to be detectable by vibration, ESA can detect most faults earlier than vibration and other technologies.

