Pump System Improvement
06/06/2016
My longtime readers know that a piping system is made of three parts: the pump elements, process elements and control elements. The pump elements add all the energy needed to move the fluid through the system; the process elements make the product or provide the service; and the control elements improve the product or service quality. Understanding how these various elements work together provides a clear picture of how the system works.
Figure 1. The example piping system. (Graphics courtesy of the author)
This month’s column will use this approach to improve the operation of a typical process system. The system in this example consists of a stock tank, spray pump, spray control valves and a spray nozzle, as shown in Figure 1.
The purpose of the system is to apply a stream of fluid onto a moving screen. The flow rate through the system is a function of the speed of the traveling screen. At the current production rate, the flow rate through the system is 600 gallons per minute (gpm).
In this example, I was working with a paper mill plant utility engineer to find ways to reduce energy consumption and improve operations within the facility’s pumped systems. This system set was the first project chosen for energy use evaluation because the spray pump, powered by a 75-horsepower (hp) motor, operates continually, and it is an easy system to understand. In addition to reducing energy consumption, the user wanted to know the reason for cavitation in the spray control valve.
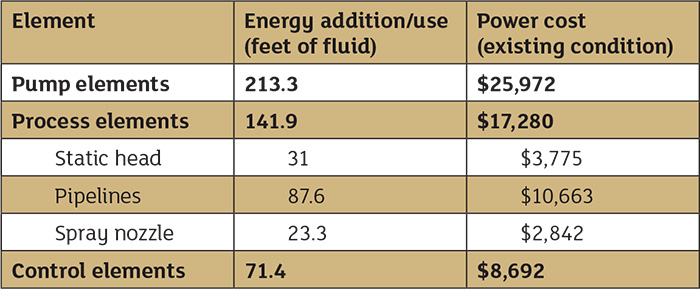
The key to any system improvement program is to first understand how much the system costs to operate. Then, each item in the system can be evaluated to determine available cost savings for the proposed improvements. In previous columns, I discussed the concept of the power cost balance sheet, which shows how much it costs to operate each item in a piping system. The power cost balance sheet for each element in the sample system shows the energy added or used by the various elements, along with the annual cost of pumping power. The calculations used to develop Table 1 can be found here.
Table 1. Power cost balance sheet for the spray system prior to system improvements
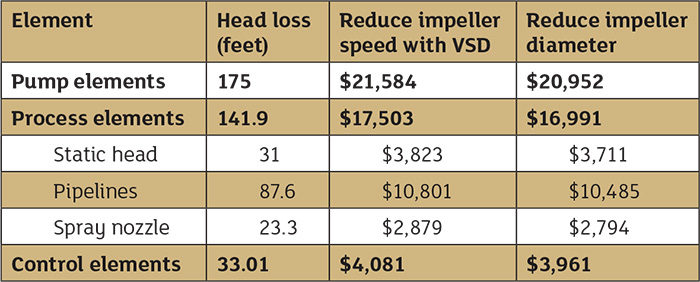
Table 1 shows the energy consumed by each item in the system in feet of fluid, along with the annual cost of operation. At 600 gpm, the pump produces 213.3 feet of fluid and costs $25,972 per year to operate.
Of that total, the process elements have a head loss of 141.9 feet of fluid and an annual operating cost of $17,280. The control elements have a head loss of 71.4 feet of fluid and an annual operating cost of $8,692. Based on this information, we can see that the energy supplied by the pump elements equals the energy used by the process and control elements.
We will use the items listed on
the power cost balance sheet to determine ways to improve the system. First, we will look at the price of the control elements.
The head loss across the control valve is 71.4 feet of fluid. The fact that the control valve is a ball-style valve is probably why the valve is experiencing cavitation. The control valve supplier suggested that the plant reduce the differential pressure across the control valve. A value of 15 pounds per square inch differential (psid) was recommended to reduce energy consumption while eliminating the problem with cavitation.
To reduce the excess pressure across the spray control, the user must reduce the amount of head developed by the pump. This can be accomplished by either reducing the diameter of the spray pump impeller or by reducing the rotational speed of the spray pump by installing a variable speed drive (VSD). Table 2 shows the results for each option.
Table 2. Comparison costs of reducing impeller speed by incorporating a VSD and reducing impeller diameter
We can see from the power cost balance sheet that the pump with the VSD costs slightly more per year to operate than the pump with the reduced impeller diameter. That is because the pump with the VSD must account for the additional losses of the VSD (which is 97 percent). This higher pumping cost that results from using the VSD is the reason for the higher costs for both the process and control elements.
At this point, you may wonder why anyone would want to use a VSD when trimming the impeller is the least expensive option in this example. The answer is that pump speed can be easily varied, while an impeller, once trimmed, cannot be varied.
In this system, the efficiency of the pump operating at the slower speed was less than 1 percent more efficient than the reduced impeller trim. In most cases, reducing the impeller diameter and pump speed has a greater effect
on efficiency.
Minimizing the head loss across the spray control valve by adjusting the energy that the pump puts into the system will reduce the power cost in this system. The lower pressure drop across the spray control valve eliminates cavitation within the valve, which reduces maintenance costs for the control valve.
To see the calculations used to develop the power cost balance sheets referenced in this column, read part 2 of this article here. Next month’s column will look at how the operating costs of the system can be reduced with a VSD by making modifications to the system.
See more Pump System Improvement articles by Ray Hardee here.