Pumping Prescriptions
by Lev Nelik

Editor's note: Reg Christmas of Kemira Chemicals Inc. contributed to this column. This column discusses the results of an eight-year reliability study conducted at a chemical plant. The plant uses six horizontal split-case cooling water pumps to provide cooling water to the production facility. These six pumps operate in banks of two units, taking suction from three cooling towers and feeding cooling water to three plant processes:

  • Crystallizer condenser (Cooling Tower A feeding Pumps A and B)
  • Process 3040 (Tower B feeding Pumps C and D)
  • Process 5060 (Tower C feeding Pumps E and F)
Figure 1. Working copy of a pump performance curveFigure 1. Working copy of a pump performance curve (Graphics courtesy of the authors)
Company management wanted to evaluate the operation of the pumps with regard to their reliability and energy consumption. The eight-year pump reliability study began in 2008 and includes the best economic use of the installed equipment. The pumps are 12x10x12XL model 8100 (11.4-inch impeller diameter), driven by 150-horsepower (hp) motors at 1,775 revolutions per minute (rpm).

Evaluating Performance

As shown in Figure 1, the best efficiency point (BEP) is at 4,800 gallons per minute (gpm) for the 11.4-inch impeller. The actual flow varies from approximately 1,500 to 6,500 gpm, depending on the process demand. As the study showed, Pumps A and B operated, on average, at a higher flow than Pumps C through F. The main indicator of reliability degradation, which typically indicates a need for repair or overhaul, is a significantly increased level of vibrations. To assess this parameter, the overall level of vibrations was measured at four locations: inboard and outboard bearing housings of the pumps and motors as well as at horizontal, vertical and axial directions at each position, equaling a total of 12 data points per monthly test. The highest value of the 12 is plotted on the charts shown in Figure 3 (page 16).
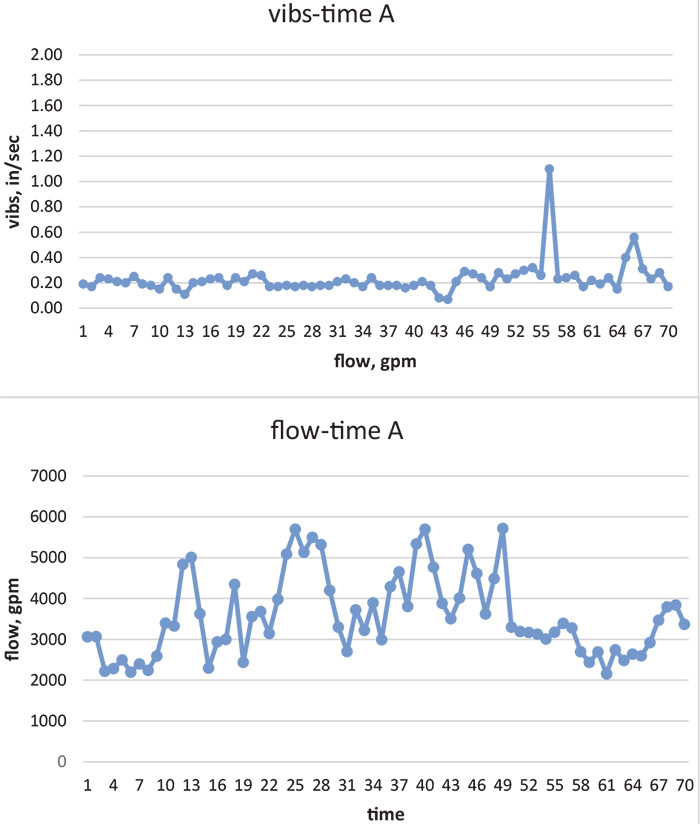
Figure 2. Vibrations and flow with time for Pump AFigure 2. Vibrations and flow with time for Pump A
As shown by the performance curve, the pumps operate within a wide range of flow, sometimes substantially too far to the left of the BEP and sometimes too far to the right. As a result, both cavitation (high flow) and recirculation (low flow) were concerns. The system went online in the 1990s, and the present management inherited the problem and wanted to find the most economical and practical solution.
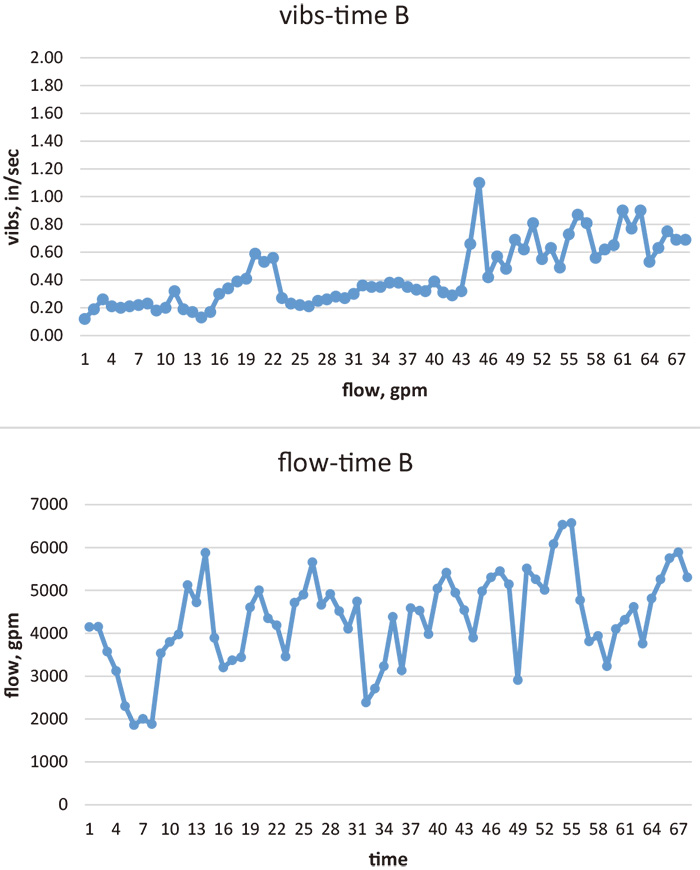
Figure 3. Vibrations and flow with time for Pump BFigure 3. Vibrations and flow with time for Pump B
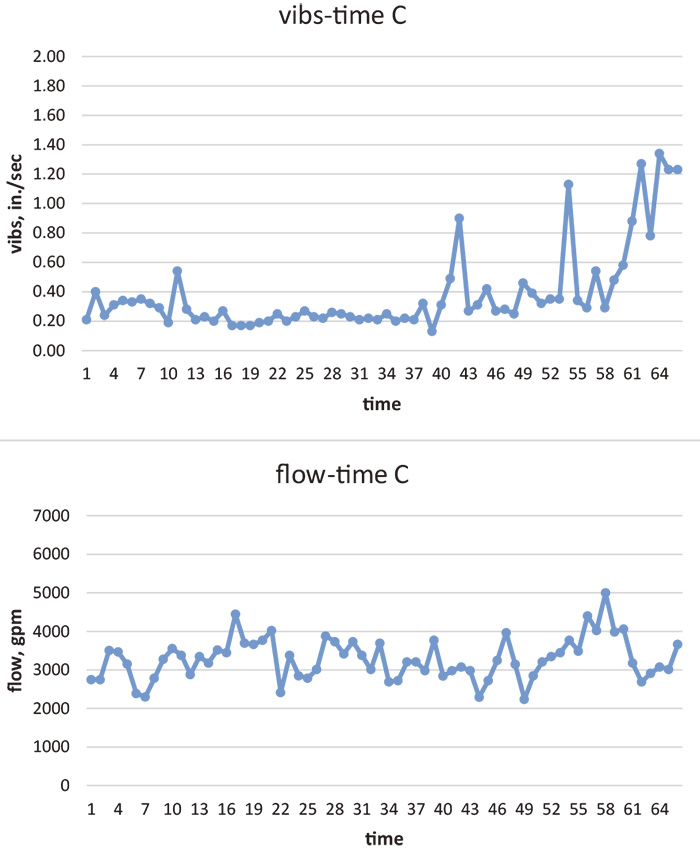
Both vibration data and flow are plotted as a function of time, as recorded in Figures 2 through 7. The time axis represents each monthly recording. Pumps are sitting on the ground level, approximately 5 feet above the water supply level, so net positive suction head available (NPSHA) is approximately 29 feet. The performance curve in Figure 1 indicates that the pumps would occasionally run out of net positive suction head required (NPSHR) when operated beyond approximately 5,500 gpm. Among the suggestions for improvement was replacing these split-case pumps with vertical turbine pumps in order to increase NPSHA to more than 40 feet, with an impeller/bell of the vertical pump positioned about 6 feet below the water level. The cost of this change was evaluated against present maintenance.
Figure 4. Vibrations and flow with time for Pump CFigure 4. Vibrations and flow with time for Pump C
The following observations can be made from analyzing the eight-year data shown in Figures 2 through 7:
  • Pumps A and B operate, on average, (disregarding occasional abnormalities) toward higher flow as compared with Pumps C through F. Pumps A and B operate between 2,000 and 6,000 gpm. Pumps C through F operate between 2,000 and 4,000 gpm. While far from perfect, this data implies that Pumps A and B operate, on the average, closer to the BEP, so they are expected to have better reliability.
  • There seems to be no clear correlation between vibration and flow, meaning there is no correlation between failure rates and flow.
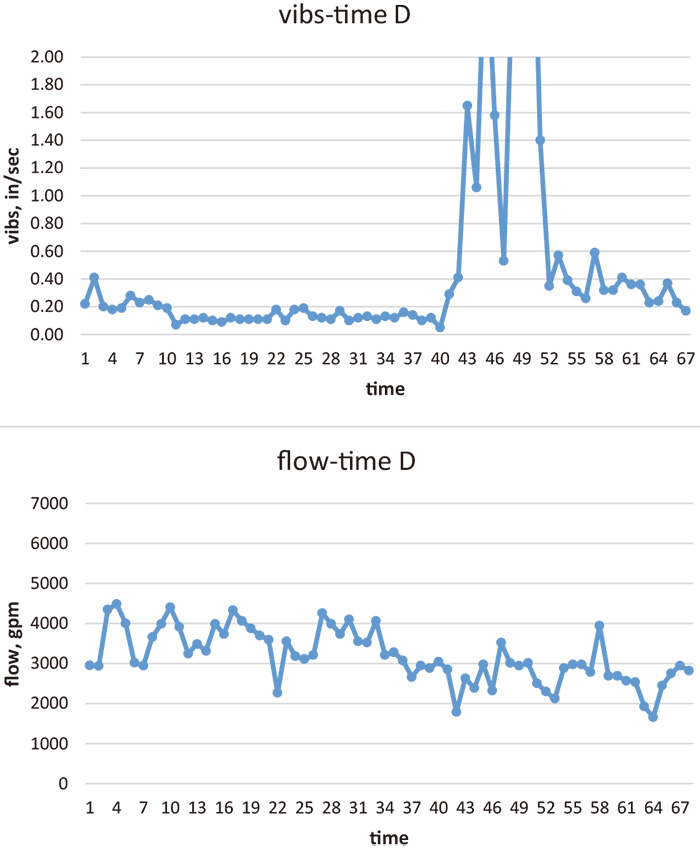
Figure 5. Vibrations and flow with time for Pump DFigure 5. Vibrations and flow with time for Pump D
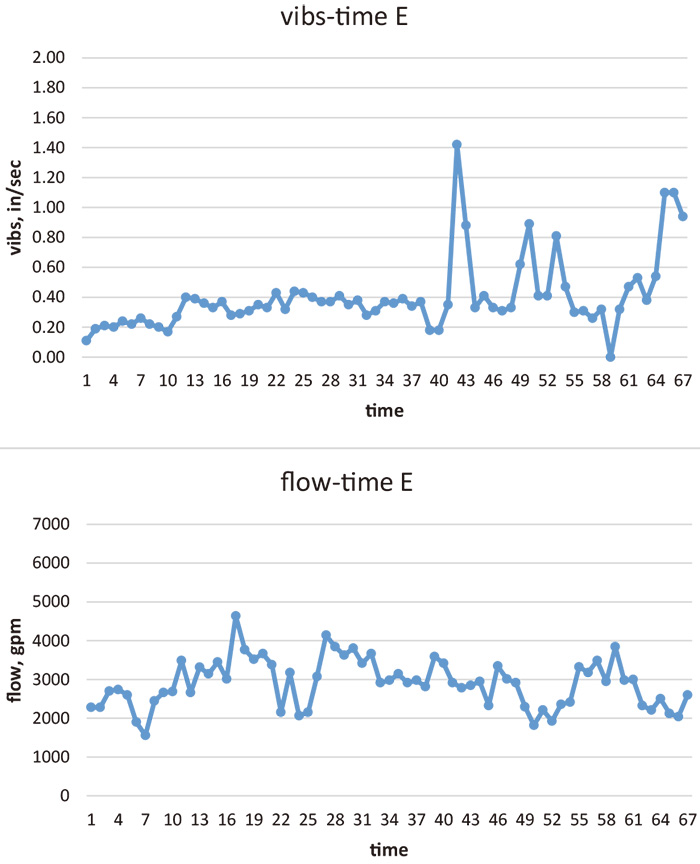
The traditionally accepted vibration levels for pumps are well-known and, depending on pump size and type, are roughly below 0.20 inches per second (in/sec) (rms values) and are usually understood to apply to new installations. For the existing installations, field-recorded values are somewhat more liberal, with 0.30 in/sec being the warning level and 0.50 in/sec being the alarm level. No known studies exist, however, to correlate vibration to failures because of the time such studies would require to accumulate reasonable statistical data to quantify the theory. The eight-year study discussed in this column is among the first of its kind and presents quantifiable, albeit perhaps limited, data on correlation between the measured vibrations and failure rate (MTBF or MTBR).
Figure 6. Vibrations and flow with time for Pump EFigure 6. Vibrations and flow with time for Pump E
Because of this lack of information, a common plant strategy was to replace the rotors when a substantial change in vibrations was observed. That level was significantly higher than the typically recommended values of vibrations usually suggested by theoreticians. For example:
  • Pump A shows two substantial spikes in vibrations (near time 55 and time 67) where the rotors were replaced, resulting in a significant decrease in vibrations until the next large spike, resulting in another rotor replacement.
  • Pump B shows spikes at times near 22 and 46.
  • Pump C shows spikes at times near 13, 43, 55 and 64.
  • Pump D shows spikes at times 43, 46 and 52.
  • Pump E shows spikes at times 43, 52 and 67.
  • Pump F shows spikes at times 27, 33 and 43.
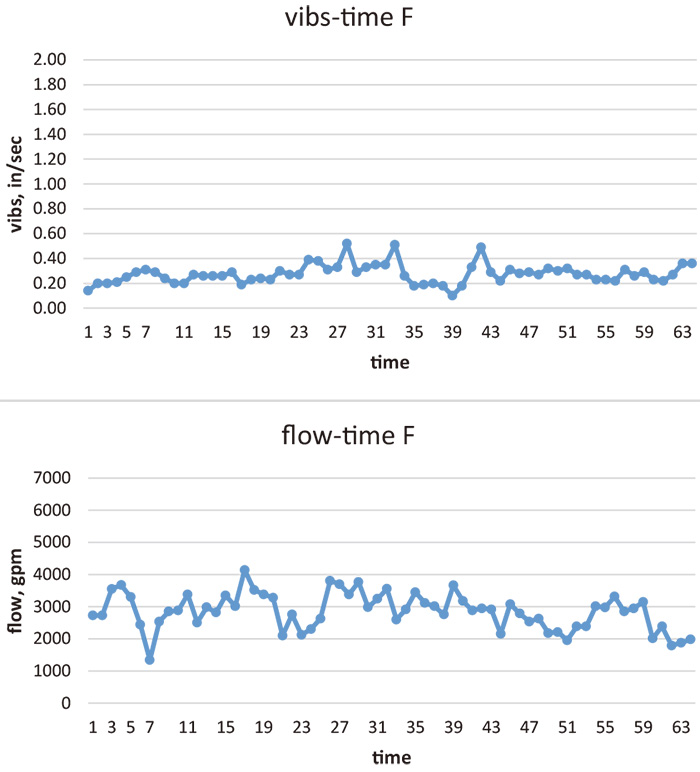
Figure 7. Vibrations and flow with time for Pump FFigure 7. Vibrations and flow with time for Pump F
Based on this information, there were 17 rotor changes in eight years, with an average of two changes for groups A through B and three to four changes for groups C through D. Therefore, the pumps operated at flows farther to the left of the BEP and had more frequent repairs, roughly 1.5 to 2 times more often. Thus, there does appear to be a direct correlation between the flow and (measured/quantified) reliability (not simply between flow and vibrations). The above statistics seem to support the following theory: Internal forces acting on a rotor increase substantially as flow moves farther to the left, away from the BEP. These forces act on bearings, causing eventual failures. However, these forces are largely unnoticed because vibration levels typically do not change much as a function of flow. Additional studies on these pumps (not reported in this column) showed that throttling the discharge valve from BEP to zero (shut valve condition) increased vibration by about 10 to 15 percent (for example, from 0.40 in/sec to 0.45 in/sec). This is essentially within statistical error of month-to-month measurements. While not easily observed by vibration spot testing, the internal forces do cause damage internally. From an economic standpoint, the cost of the rotor, including labor, is about $119,000 ($7,000 x 17) for eight years, or $15,000 per year. The cost of a typical double-suction pump of this size is roughly $15,000, while a similarly rated vertical turbine is usually double that, about $30,000. Because the new motors would need to be used, the total unit cost of the vertical turbine pump would have been about $40,000, or $240,000 for all six pumps. Adding to this installation cost, the total project would likely cost around $350,000. If piping modifications are to be included (to even the flow), the grand total project cost would be nearing half a million dollars. That would imply a payback time of 23 years ($350,000/$15,000)—clearly not a good number, even if the installed vertical pumps never fail. However, by nature of the design, vertical turbine pumps are generally not more reliable than double-suction split-case pumps, which have two bearings rigidly supporting the rotor on two ends. Vertical pumps, having a long cantilever design, have a slender rotor, which is susceptible to deflections and damage when operating at flow rates even slightly off the BEP. As a result, the failure of the vertical turbine pumps would have been more frequent, and the cost of repair would have been greater than that of a double-suction pump rotor. An obvious culprit of this issue is a wide variation of flow. The total maximum flow demand (assuming 6,000 gpm as maximum) is 36,000 gpm (6,000 x 6). If piping could be modified, and perhaps variable frequency drives (VFDs) implemented, the flow could be controlled and maintained to always be at the BEP, with the VFD varying the BEP. However, this setup would raise two concerns: cost and reliability because of a new need to maintain and service the controls.
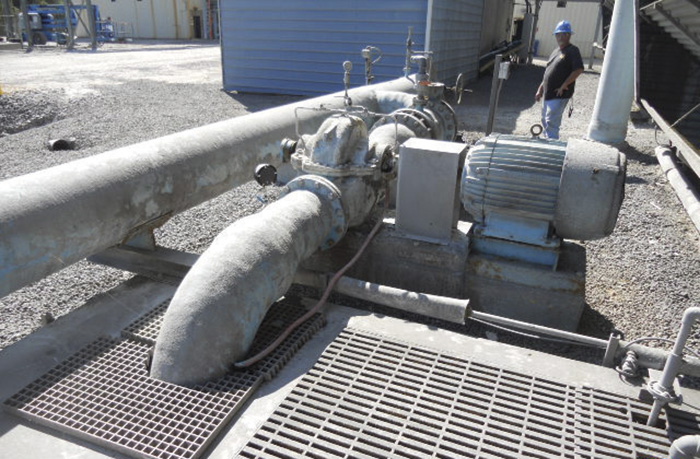
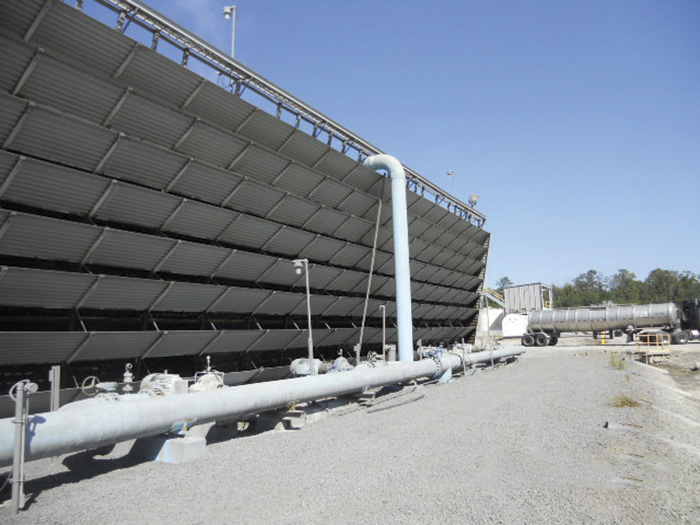
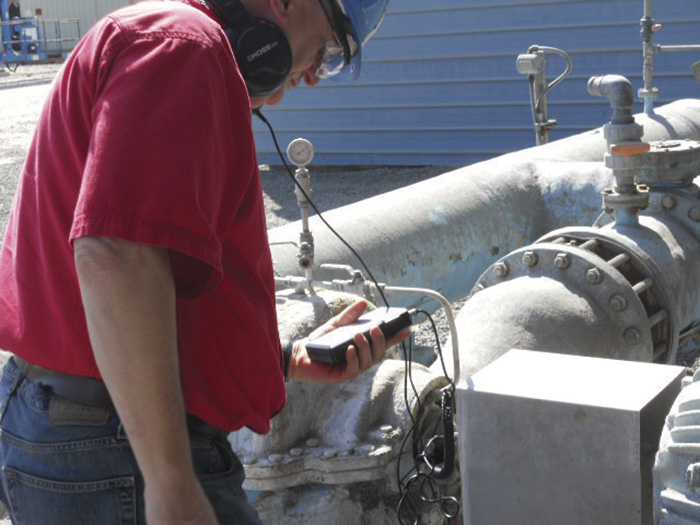
Images 1, 2 & 3. Overall view of the system, showing the six pumps in the study
Images 1, 2 & 3. Overall view of the system, showing the six pumps in the studyImages 1, 2 & 3. Overall view of the system, showing the six pumps in the study
While such a system can, in theory, provide smoother operation and fewer failures, the cost of implementation is substantial. However, this setup cannot be ruled out completely, because the cost analysis of alternatives must be considered. The authors would like to extend their appreciation to the company management for permission to publish this information, and they would be pleased to hear feedback, questions and any comments from readers about the information in this report. References
  1. Nelik, L., "Energy/Efficiency Studies by On-Line Efficiency Monitoring System (PREMS-2A), doctorpump.com
  2. Nelik, L. and Moskovich, D., "Efficiency Evaluation for the Vertical Turbine Pump, Clean Water Well", Weizmann Institute reports
  3. Pumping Machinery Technology Program, PREMS-2A (Pumps Reliability and Energy Monitoring System): pumpingmachinery.com/pump_school/PVA/pva.htm (module #11 and #10)
See other Pumping Prescriptions articles here.

Issue