A pipeline station and tank farm in the Southwest uses four identical four-stage vertical booster pumps driven by 300-horsepower (hp) electric motors to transfer crude oil between various storage tanks. The piping systems and support structures are identical. To expedite the process, the facility made plans to increase pump output by adding a fifth stage and a larger 400-hp motor. Before moving forward with the planned upgrades, the facility had to identify and resolve several questions concerning ongoing vibration-related issues. It needed to determine if the planned upgrades would exacerbate current or create new vibration-related anomalies. Using vibration signature analysis, operating deflection shape (ODS) and experimental modal analysis (EMA), the end user was able to identify the cause of the current vibratory forces. In addition, structural dynamic modification (SDM) software was used to analyze the dynamic effects the planned upgrade and increased pump output would have on the system.
Background
The operations team chose Booster Unit (BU) 3 and BU 4 (see Image 1) to be the subject of this study.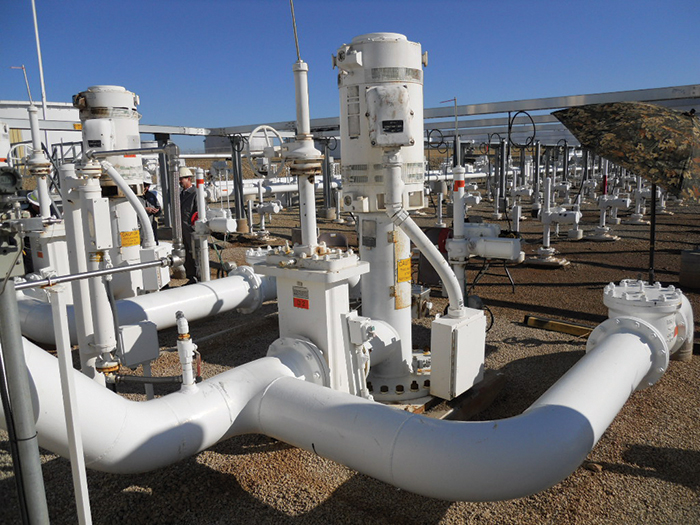 Image 1. Booster Unit 3 and 4 (Image and graphic courtesy of ProPump Services)
Method of Testing
The data acquired for both studies included signatures for the basic vibration, ODS and EMA analysis. Each data acquisition method is summarized below:- Basic vibration analysis: High-resolution vibration measurements were acquired at the locations identified in Image 1. The data is presented in terms of velocity. The velocity of the signature is a measure of the maximum speed at which the mass is moving or vibrating during its oscillations. The faster the flexure, the sooner a system will fatigue. Vibration velocity is directly related to failure.
- ODS analysis: The ODS models presented were generated from the measurement of 120 triaxial vibration signatures while the pumping system was operating under typical speeds and loads. The deflection of the models is the result of the vector summation of the triaxial measures at each point, which produces a force vector that includes amplitude and phase. The computer deforms the models accordingly and combines them into animations, providing insight into how the system elements perturb at discrete frequencies under normal operation. The perturbations of the models are a combination of the reaction to the forcing functions and the amount of mechanical damping at the specific point on the model.
- EMA: Similar to the ODS, the same 120 triaxial signatures were taken. However, the difference is that the system was not operating and a measured excitation force was applied—in this case, by a tuned model hammer. This type of force response testing identifies the system's natural frequencies. When a forcing function coincides with a natural frequency, the vibration amplitude at that frequency can be significantly amplified. Vibration signatures were recorded at the locations in Image 1.
Study 1 ODS at 1,788 RPM
The animations revealed that the torsional forces generated by the motor rotor were twisting the discharge head. This motion was imparted to the discharge nozzle, which also produced a torsional force. At the nozzle, force transitioned to the discharge block valve, forcing the valve toward the right angle discharge piping. The force reversal, due to the spring constants of the discharge head and nozzle, resulted in a rocking motion of the valve perpendicular to the pump. The valve motion imparted the torsional force into the attached T-junction, forcing the straight run piping to twist, drawing it back toward the pump and driving the right-angle section downward. Acting as a moment arm, the right-angle piping imparted a torsional force into the attached piping, resulting in a torsional motion that changed direction as it transitioned through the check valve. This produced a sinusoidal motion along the long axis of the pipe.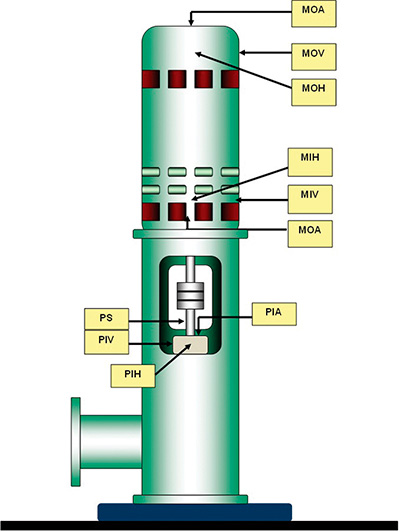 Figure 1. Typical vibration data points identification